DOW + 165 = 23,328 (Record)
S&P 500 + 13 = 2575 (Record)
NAS + 23 = 6629 (Record)
RUT + 6 = 1508
10 Y + .06 = 2.38%
OIL + .37 = 51.66
GOLD – 9.70 = 1281.00
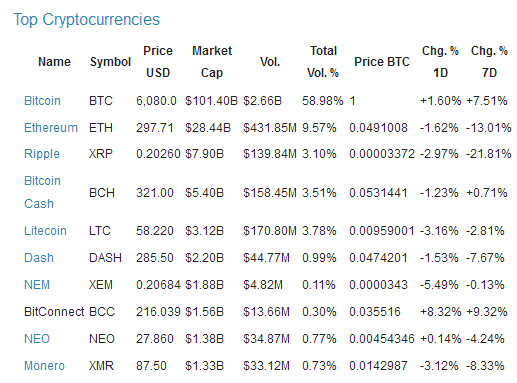
Cryptocurrency
- Number of Currencies: 875
- Total Market Cap: $173,502,181,290
- 24H Volume: $4,521,356,959

Record highs for the Dow, S&P and Nasdaq – marking the 24th time this year that all 3 major indexes hit records on the same day. The Dow has posted 53 record highs this year, while the S&P has notched 49, although the number of highs is almost irrelevant. More important is the strength and duration of the trend.
The S&P has been extremely steady – notching 241 days without a decline of 3% or more. If the S&P can continue this calm trading, it would break a record going back to 1995. the S&P 500 is on pace for its ninth consecutive year in the green, which would match a similar streak from 1991 to 1999.
For the week, the Dow gained 2%. The S&P 500 was up 0.9 percent for the week while the Nasdaq added 0.4 percent. The Dow and S&P have now posted gains for 6 consecutive weeks. The Nasdaq is up for 4 weeks.
What about valuation? At Friday’s close, the S&P 500 traded at 19.5 times forecast earnings, the highest since the dot-com era. It represents an earnings yield of 5.1 percent, more than double the payout from 10-year Treasury bonds.
While third-quarter profit growth is forecast to drop to 2.6 percent for S&P 500 companies from around 10 percent in the first half, we need to remember the impact from hurricanes on third quarter results, and expect a rebound in coming quarters. While earnings have been good, enthusiasm today was focused on tax cuts.
Today marks 9 months of the Trump administration, so it’s a good time to look at how the markets and the economy have been performing. Thanks to Rex Nutting at MarketWatch for putting together the research over the past 25 years. The stock market, as you know, is doing quite well in comparison with past periods.
Since Jan. 20, the S&P 500 is up 12.8%. It’s been better than that over a nine-month period about a third of the time since 1992. The best nine-month period was between April and December 2009, when the S&P soared 46.7%. The worst period was in the nine months just before that, from July 2008 to March 2009, when it fell 43.6%.
The market was better than it is now about 46% of the time while Bill Clinton was president, 34% under Barack Obama, and 14% under George W. Bush. So, the market is good but hardly unprecedented.
The job market has also been strong, averaging 140,000 net jobs a month since January, which works out to 0.8% growth. Job growth has been better over an eight-month period about two-thirds of the time since 1992. It was better 97% of the time under Clinton, 73% of the time under Obama, and 37% of the time under George W. Bush.
The economy grew at a 2.1% annual rate in the first half of the year and is expected to maintain that trend (perhaps a tick higher) for the foreseeable future. It’s grown faster than that about two-thirds of the time since 1992, but most of those faster periods were in the 1990s.
The best two-quarter period was at the end of 1999, when it grew at a 6.1% pace. The worst two-quarter growth was the 6.8% decline at the end of 2008 and the beginning of 2009. Growth was faster than the recent 2.1% growth half of the time under both Obama and Bush 43. Growth was faster 91% of the time when Clinton was president. The conclusion: the markets, jobs, and economic growth are good, but not the greatest.
The National Association of Realtors reports sales of existing or previously owned homes rose 0.7% in September to an annual rate of 5.39 million, breaking a three-month losing streak. The number of homes available for sale climbed 1.9% in September, but total housing inventory was still down 6.4% compared to a year ago at 1.9 million. The median price of an existing home increased 4.2% to $245,100.
