Market structure is currently stretched to the limits. Stocks and Treasuries tend to maintain a negative correlation due to the fact that investors rotate funds between growth and security as well as between an optimistic and pessimistic outlook on interest rates, which are subject to economic growth.
Ironically, equity weakness is also its strength. The higher stocks climb, the less attractive their prices become. This, compounded by a Treasury selloff, has propelled yields to their highest level in almost four years. For many investors, the higher the yield, the more attractive one 'bird' assuring some fixed income becomes versus the riskier 500 'birds' on the SPX 'tree' that are now just 6-percent away from what could be the perilously high nosebleed 3,000-price level.
Meanwhile, the rising yield—generally expected to positively correlate with a rising dollar)—has decoupled from the currency, in what may be an omen of the disruption a breakdown in market structure would bring. Should investors decide to rotate out of stocks and into Treasuries, it could instead lead to a selloff of all risk assets, including the dollar and Bitcoin which we analyzed here yesterday.

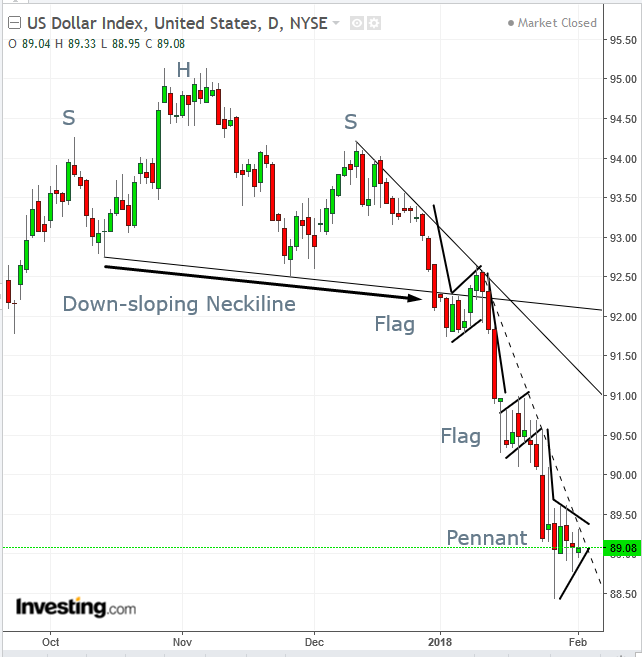
The downside breakout of the USD's H&S top, whose neckline is down-sloping – projecting demand weakness, as it has failed to support prices at the October 13, 92.75 price – has more than proven itself.
While the pattern’s implied target, the base on the shorter end of its height (where the October trough is higher, and therefore closer to the November peak than the November trough) was 240 pips, or 2.5 percent, the January 26, 88.44 low was achieved at 383 pips, or 4.16 percent move, and it’s set to fall further. Fundamentally, most market players are shorting the dollar. Technically, a multi-year bearish pattern has been completed.
The downside breakout of the down-sloped neckline coincided with (or perhaps required) a flag continuation pattern, in which the “old, tired traders” of the December 27-January 2 move which drove the currency higher by 1.7 percent, had a chance to exit the ride, while “new, energized traders” were able to participate in the next leg-down, namely the January 10-January 15, 2.45 percent slip.
The same dynamic repeated itself with a second flag, in which after the January 10-January 15, 2.45 percent move higher, some traders checked-out with their winnings intact, providing an opportunity for the next generation to try their hand in the new territory. Upon reaching the January 26, 88.44 low, those traders were finally able to retire, passing the mantle to the current generation, trading within a pennant continuation pattern, which has the same dynamic as a bearish, rising flag pattern.
Trading Strategies
Conservative traders would wait for a downside breakout, whose penetration should reach at least the 88.50 level. While a further decline would post a lower trough, solidifying the downtrend and therefore providing a stronger signal, a rebound from that level would be understandable, because of the support it’s expected to provide. Therefore, traders might wait for a return move to test the integrity of the pennant with a down-day whose open-to-close price action (excluding prices above open and below close) wipes out the gains of the preceding up-day’s open-to-close price.
Moderate traders might wait for the downside breakout and a return-move for a better entry, closer to the presumed resistance of the pennant, for a better risk-reward ratio, but they won't necessarily wait for it to confirm its integrity.
Aggressive traders are likely to be content with just the downside breakout.
