Three weeks ago, we published Why Are Dollar Bears Back?. In the post we predicted a dollar decline and provided trading strategies. At the time, this was contrary to the prevailing trend for the global reserve currency, which was moving higher from its low of November 27 with a 1.7 percent rally.
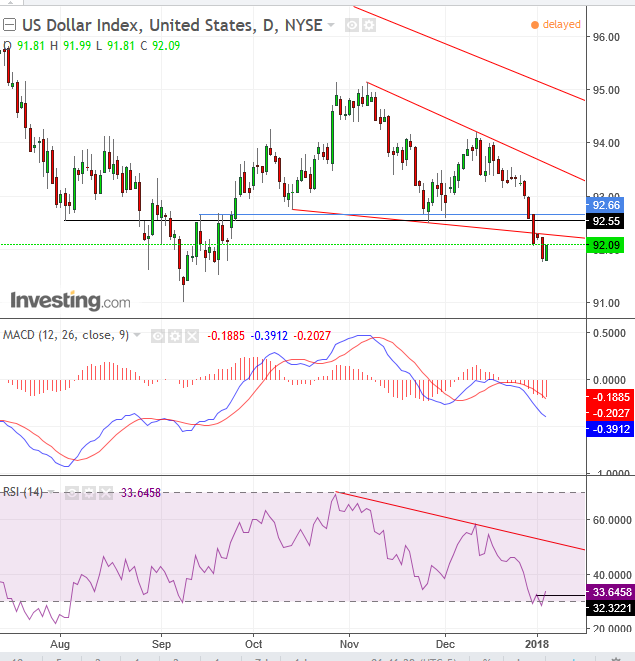
Since our post three weeks ago, the DXY declined by 2 percent. We bet that the index would form a right shoulder to a H&S top. It did...and it broke its neckline to boot, by 0.59 percent.
Yesterday we analyzed dollar bearishness here and forecast that gold would rise as the dollar falls.
Today, we'll provide analysis and trading strategies for the current dollar probabilities.
The H&S top neckline sloped because traders did not step up to absorb supply at the October 13, 92.75 level. They were expected to after they saw the index rise 2.65 percent from that point in the following two weeks through October 27. Drying demand speeds the pattern’s bearish implications. The disadvantage of a falling neckline is that the price chases it lower, as it angles further down with each passing day, eating into its target.
This sloping neckline has been penetrated only 0.59 percent. The small penetration opens the potential for a pullback, after stopping out positions. This is referred to as a bear trap, as traders, convinced of a downside breakout, assume bearish position which turn out to be traps.
The minimum, aggressive filter to avoid a bear trap is 1 percent, and that would be achieved with a decline to 91.38. A moderate 2 percent decline would be achieved at 90.46, and a 3 percent aggressive breakout would bring the price to 89.54. Naturally, barring a meaningful correction, the target would have been included within the filter.
Both the MACD (which measures price data of different periods) and RSI (which measures momentum and tends to precede price movements) are falling along with and confirming the decline in the price. However, the RSI has reached the generally accepted oversold level of 30, dipping below to 28.39 and climbing back up, completing a double bottom, a sign that it will rise, suggesting price will follow momentum.

Still, the momentum could rise, but as long as the RSI trends below its downtrend line, currently at 50.00, this potential bounce would be considered a correction within the prevailing downtrend.
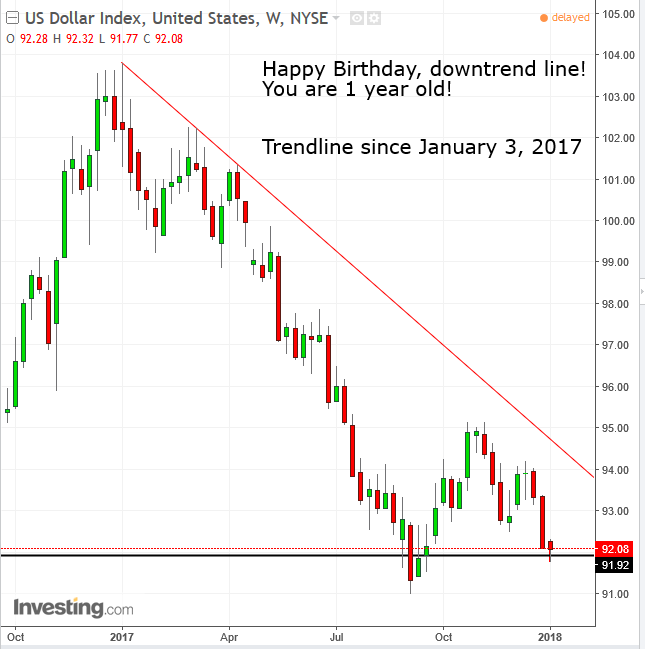
While the price has been trading below a downtrend line for a full year, beginning on January 3, there is a potential for a bottom as the price bounced off the support of the former May trough, from the September 91.00 low of 4.5 percent to the October, 95.00 high. Considering that the current price is within 1 percent of a trading range since early 2015, there is the potential for another long-term bounce to the 100 levels.
Falling Bullish Wedge Ahead?
Should today’s upward correction persist and return into the pattern currently considered a down-sloping H&S top and provide an upside breakout from the pattern’s top, it would transform it into a falling bullish wedge, which would suggest that the price would continue to rise and cross the year-old downtrend line, potentially back toward the 3-year range top of the 100 levels.

Trading Strategies – Short Position
Conservative traders should wait for the neckline penetration from the breakout point of 92.30 to reach a 3 percent filter to avoid a bear trap. This would also dispel the likelihood of a bottom, as it would have fallen more than 2 percent below the September bottom and the 90.00 key-level to boot.
Moderate traders should wait for a 2 percent filter, which would bring the price 0.6 percent below the September bottom, still at risk of a bear trap, as well as above the 90.00 key level. However, with a rise to 92.75, the first low of the neckline, which is aligned with the November 24 closing price in the second low of the neckline, traders may risk a short position, with a close stop-loss above their entry point and until above the psychological round 93.00 number, with a 91.77 first target of yesterday’s low’s support and a 91.01 second target of the September low’s support.
Aggressive traders would ideally wait for a 1 percent penetration of the neckline, or risk a short with a return to the neckline, currently at 92.30, with a short stop-loss and the targets mentioned in the previous paragraph.
