Investing.com’s stocks of the week
Facebook Deals A Blow To Cryptocurrencies
If the mounting regulatory pressure wasn’t enough for cryptocurrencies, the Facebook (NASDAQ:FB) ad ban on promoting initial coin offerings on its site might have dealt a coma-inducing blow to cryptocurrencies. Worse than just a ban, Facebook grouped cryptocurrency ICOs with binary options, a sector that has fallen out of favor with retail traders.
The language used by the biggest social network in the world, that these digital assets are “frequently associated with misleading or deceptive promotional practices” may cause unsuspecting investors to take a harder look before they max out their credit cards on the promise of digital riches.

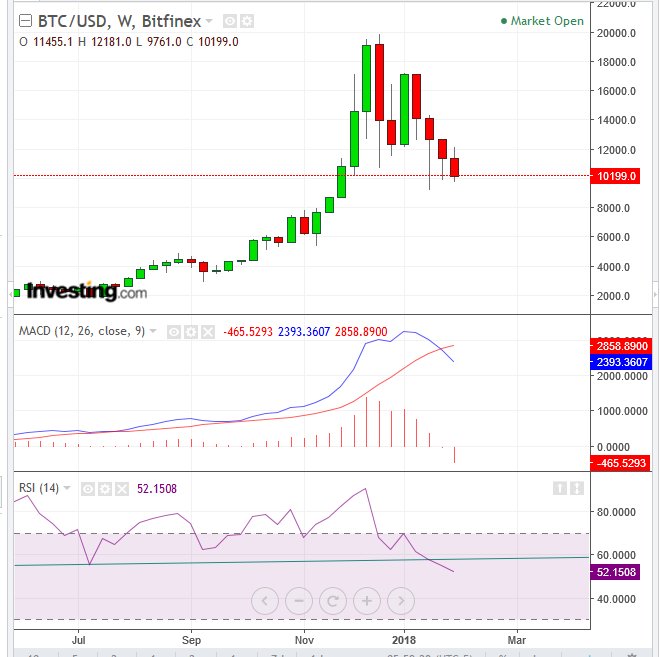
The momentum gauge RSI and statistical moving average gauge MACD both crossed below, providing the strongest sell signal since Bitcoin became a household name.

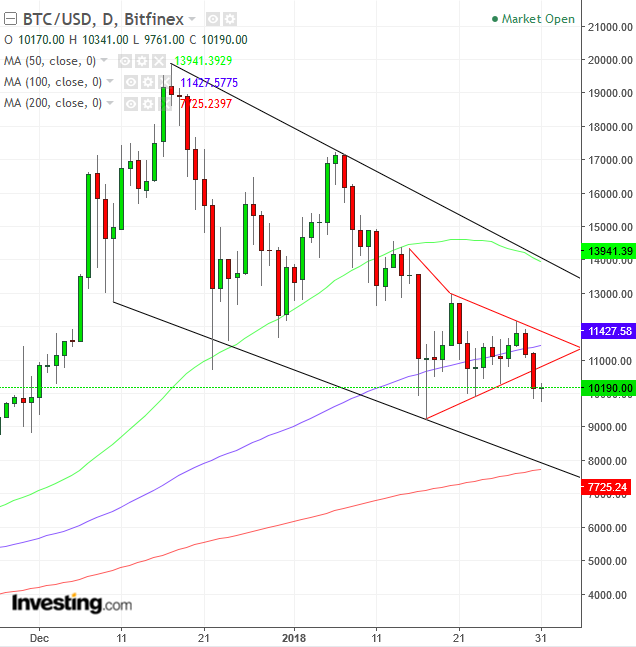
The digital currency king provided a downside breakout of a pennant continuation pattern, within a falling channel since December 17. Note that the formation of the bearish pattern itself emerged upon crossing below the 50 dma (green) and the breakout coincided with crossing below the 100 dma (blue), while the 200 dma (red) took a position, realigning with the channel bottom.
These are all supply/demand pressure-point steps, in which the final fall below the channel bottom/200 dma would signal a steeper fall. On the other hand, should the 200 dma maintain support, the channel bottom would bounce the price back toward the channel top, presumably to fall back even lower.

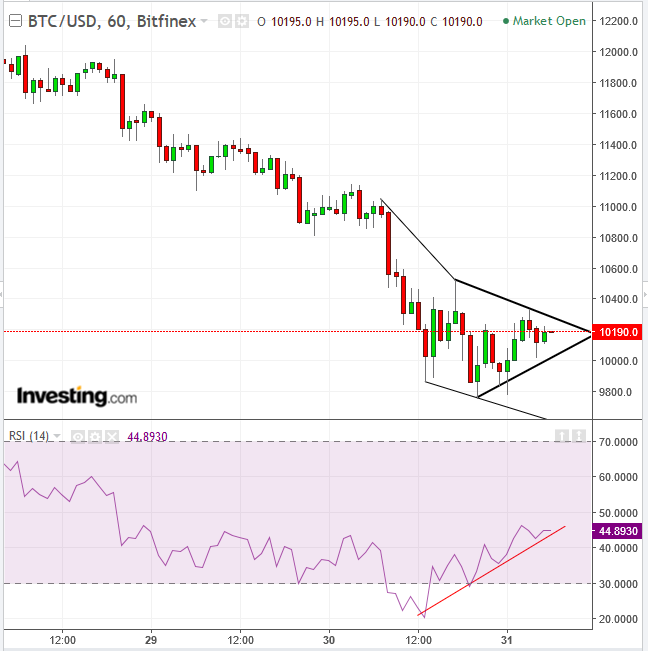
BTC is forming a pennant on the hourly chart. Note that the top is parallel to the support line, also forming a falling channel. A downside breakout would signal a resumption of the trend within the falling channel. A breakdown would also follow an RSI falling below its uptrend line since 13:00 EST Tuesday.
Trading Strategies
Conservative traders would wait for a downside breakout of the pennant, followed by a return move toward the channel top and finally for a confirmation of its integrity, with a red candle whose real body (price between open and close, excluding shadows) covers the green candle’s real body from the preceding day.
Moderate traders would wait for the same, except for the channel top to demonstrate integrity, therefore enjoying an entry closer to the resistance of the channel top, affording a superior risk-reward ratio.
Aggressive traders would short with a downside breakout of the pattern, while the especially aggressive traders would do so with even just an RSI crossing below its uptrend line.
Targets:
Long-term: $6,000, potentially within a month
Short-term: $9,000, potentially within a couple of days
