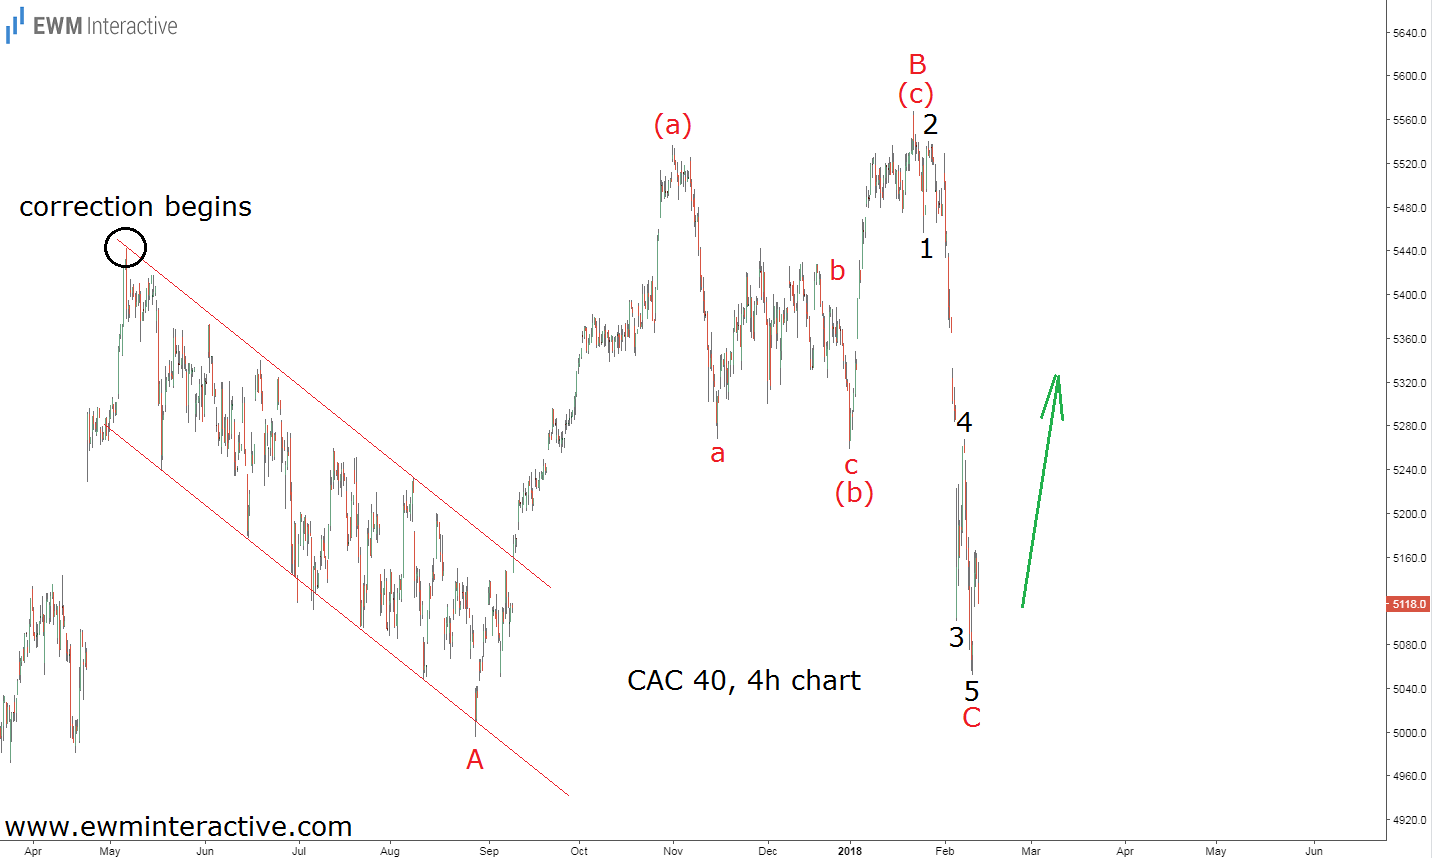
The recent market selloff spared no-one. Investors were reminded what fear was after stocks plunged sharply all around the globe. From the Dow Jones Industrial Average to the German DAX 30 and even in China, major benchmark indices suffered their biggest declines in years. Needless to say, French stocks tumbled, as well. The French CAC 40 index fell from 5538 to 5051 to erase five months of gains in just two short weeks for a total loss of 8.8%.
The question everybody is asking is whether this is the start of an even bigger crash or buying opportunity. The only thing we know for sure is that fear and panic would only make things worse. Instead, we rely on the Elliott Wave Principle to navigate us through this turbulent environment.
The chart above puts the recent selloff into Elliott Wave perspective. It looks like it is part of a larger running flat correction, labeled A-B-C. Wave A traveled in a slow and overlapping manner within the boundaries of a corrective channel down to as low as 4995 between May and August, 2017. Then, the bulls returned to lift the CAC 40 to 5567, which was its highest level in 10 years. Unfortunately, the rally between 4995 and 5567 was made up of just three waves, indicating the market was still in pullback mode and a five-wave impulse to the south should follow.
Today is February 13th and we can already count five waves within wave C down to 5051. If this count is correct, the entire A-B-C running flat correction is over. This, in turn, means the larger uptrend is supposed to resume towards a new high beyond the top of wave B at 5567. Even if it turns out wave C did not end at 5051 and the CAC 40 loses another 100-150 points, it would only mean the running flat has evolved into an expanding one. A slight breach of the 5000 mark would not be enough to invalidate the positive outlook.
