Stocks Pop
Let me update the discussion in last week’s missive “Bears Gain On Bulls:”
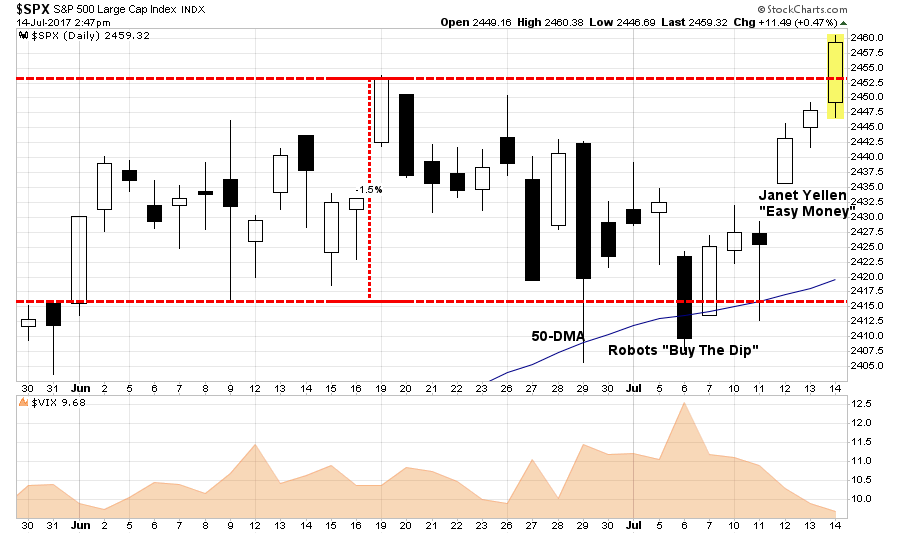
“The last couple of weeks have experienced a sharp rise in price volatility. While stocks have vacillated in a very tight 1.5% trading range since the beginning of June, there has been little forward progress to speak of. However, notice that support at 2415 (50-dma) has remained solid as ‘robots’ continue to execute their program of ‘buying the dips.'”
The S&P 500 chart below is updated through Friday afternoon:
With respect to portfolio positioning I also stated:
“This lack of progress keeps us ‘stuck’ with respect to portfolio positioning.”
However, this changed this past week as Yellen uttered the two magic words: “EASY MONEY.”
Okay, it wasn’t exactly two words. It was actually:
“Because the neutral rate is currently quite low by historical standards, the federal funds rate would not have to rise all that much further to get to a neutral policy stance.”
In other words, by saying that interest rates would not have to rise much further, the markets translated that to “lower interest rates for longer,” confirming the Federal Reserve will remain “highly accommodative” to the markets so, therefore, “buy stocks.”
And with that, the robots leaped into action pushing markets OUT of the month-and-a-half long trading range of just 1.5%. This push to new highs, as noted above, also triggered a short-term “buy signal,” at the bottom of the chart, which suggests this rally should continue higher over the next week, or so, heading into the month of August.
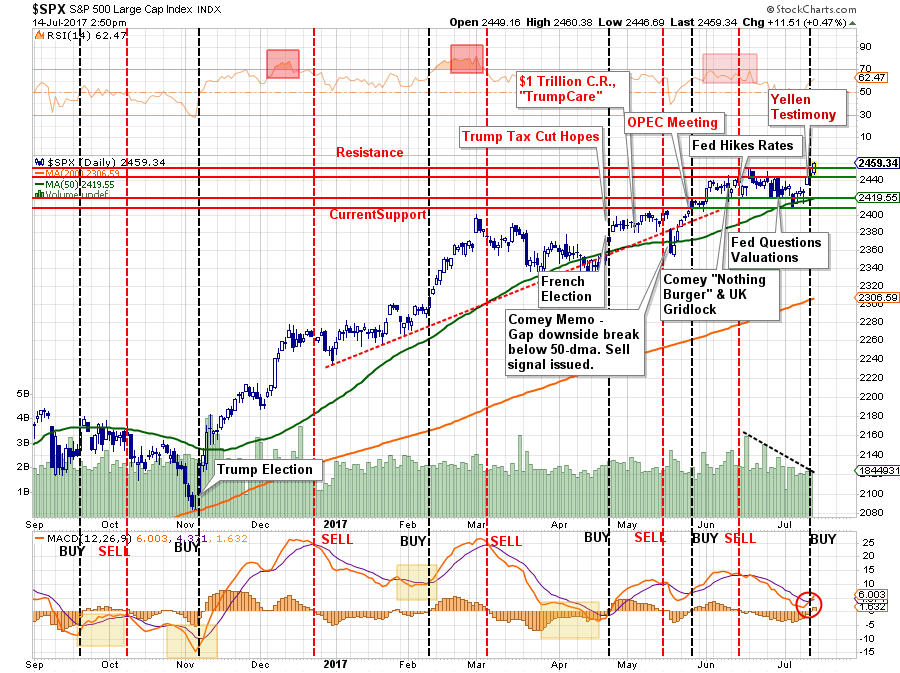
With the break above 2452 on Friday, assuming it will hold above that level into next week, it will provide an opportunity to increase short-term equity allocations in portfolios. However, be mindful, this is VERY short-term in nature and could be quickly reversed – so manage your risk accordingly.
As I noted last week:
“I remain very cautious on the overall market, currently…However, the trend remains bullishly biased which keeps portfolios allocated on the long side for now.
With that said, the recent ‘sideways’ movement has NOT worked off the previous overbought condition of the market on an intermediate term basis as shown below.”
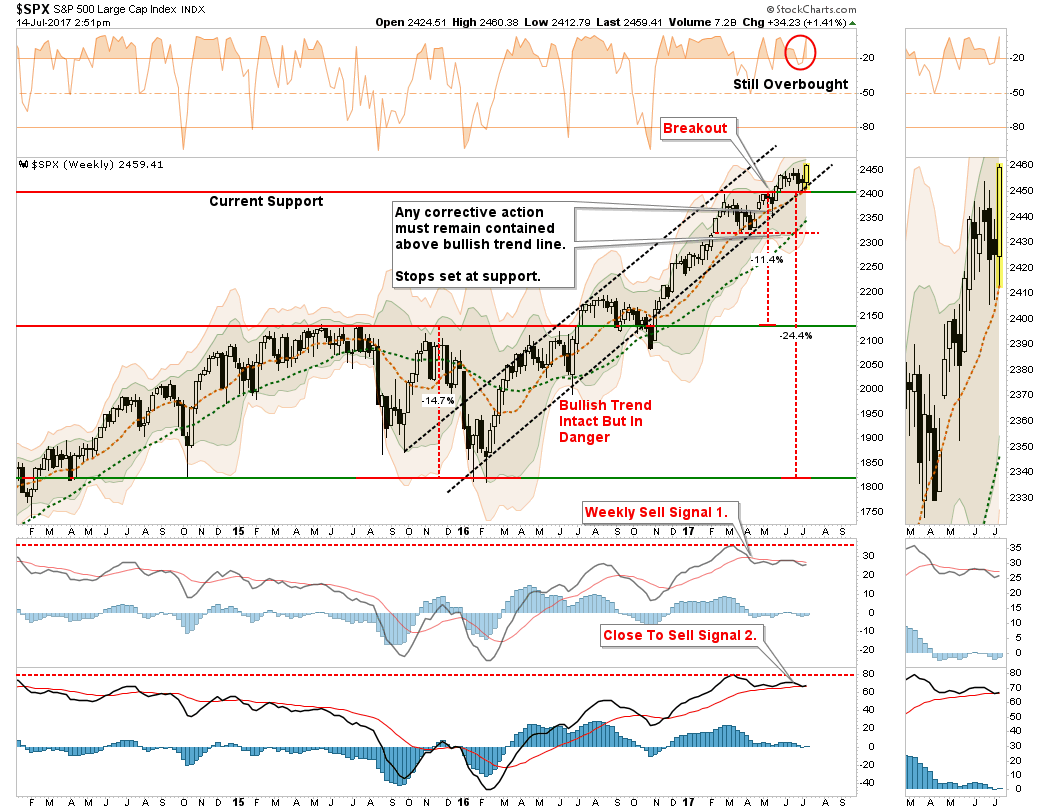
One note of caution, the advance this past week was NOT strong enough to reverse either “sell signal” currently. However, if the advance continues through next week, those signals will turn positive giving more short-term support to the bullish advance.
Next Stop 2500 or 3000?
Back in early June, I posited the idea of a new price target for the market of 2500. To wit:
“Let me state this VERY clearly. The bullish bias is alive and well and a move to 2500 to 3000 on the S&P 500 is viable. All that will be needed is a push through of some piece of legislative agenda from the current administration which provides a positive surprise. However, without a sharp improvement in the underlying fundamental and economic backdrop soon, the risk of something going ‘wrong’ is rising markedly. The chart below shows the Fibonacci run to 3000 if ‘everything goes right.'”
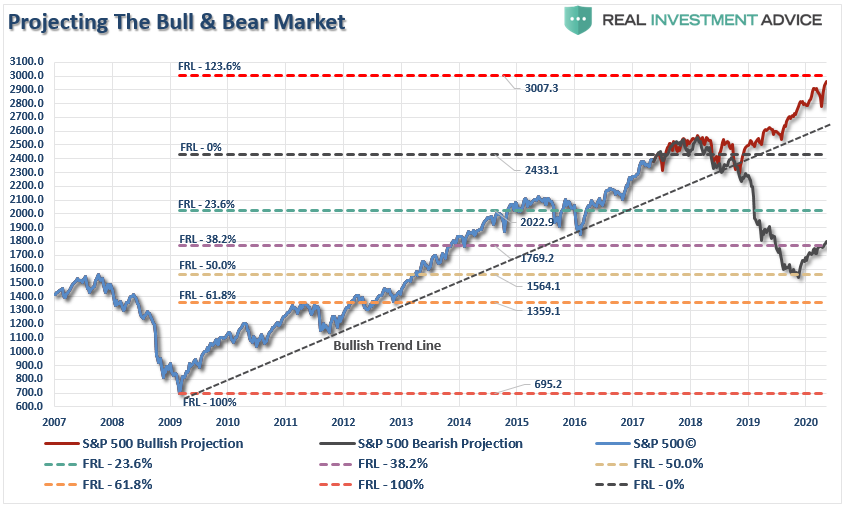
Given that a major piece of legislative agenda has NOT been pushed through as of yet, there remains “hope,” combined with the support of Central Banks globally, which continues to support the acceptability of higher current valuation levels.
While the short-term outlook is bullish, the longer-term back drop still remains highly risky. I have shown the chart previously of the 3-phases of a “bull market” advance. The current near “vertical acceleration” of the market has been indicative of previous “3rd-phase melt-ups” in the market.
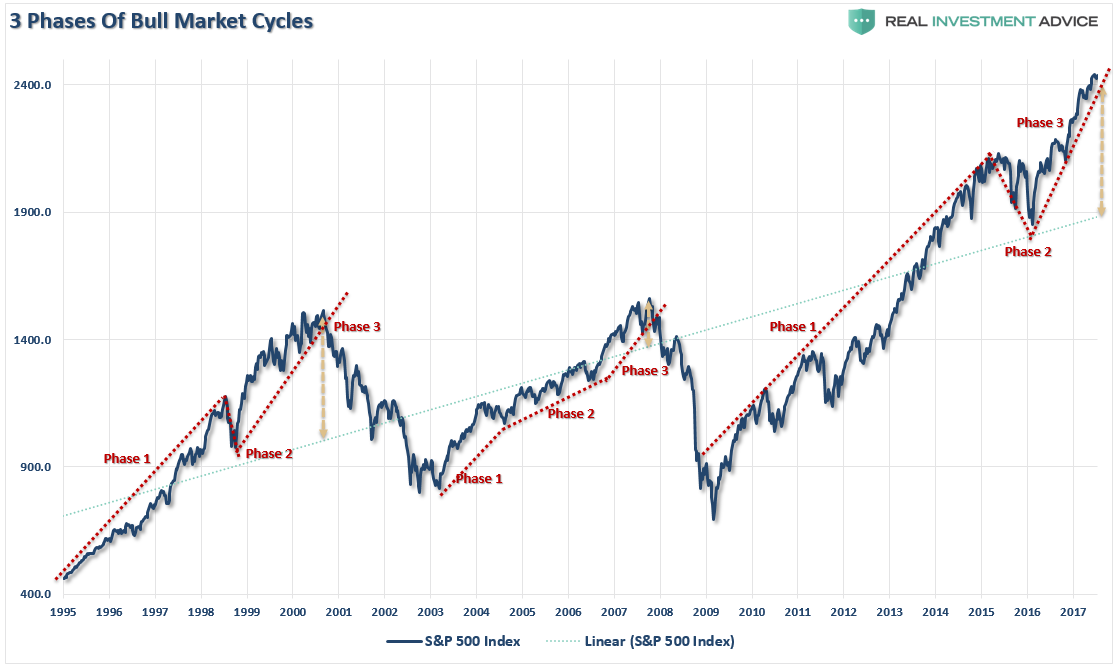
Of course, such phases of “exuberance,” can last longer and rise further than logic would dictate. So, it is important to dismiss the duration, and extent, to which illogic can prevail.
Importantly, notice in the chart above the deviation from the long-term linear trend line of the market. Such deviations can NOT last forever. As such, it is always important to remember that ALL bull-runs are a one-way trip.
While our investment discipline requires us to take on additional exposure with this breakout, we maintain very tight stops and have a very disciplined process for handling risk. The risk YOU have to weigh is, from current levels, IF everything goes right there is roughly 600 points of upside. If something goes wrong there are 900 points of downside.
Are those odds you are willing to take?
It’s easy to get wrapped up in the bullish advance, however, it is worth remembering that making up a loss of capital is not only hard to do, but the “time” lost can not.
While the media, and bulk of the mainstream commentary, continue to “urge you to ride the bull,” just remember they are not going to tell you when to get off.
And when the ride does come to an end, the media will ask first “why no one saw it coming?”
Then they will ask “why YOU didn’t see it coming when it so obvious.”
In the end, being right or wrong has no effect on the media. They DON’T manage your money. Nor are they held responsible for consistently poor advice. However, being right, or wrong, has a very big effect on you.
Let me repeat for all of those who continue to insist I am bearish, and am somehow missing out on the “bull market” advance:
“While our portfolios remain long currently, we do so with hedges and stops in place, a thorough methodology of analysis and a strict investment discipline we follow to mitigate the risk of long-biased exposure. In other words, whenever the market does turn, we will sell and move to cash.”
If you are going to “ride this bull,” just make sure you do it with a strategy in place for when, not if, you get “bucked off.”
Volatility Cycles
The smell of “fear” was quickly eviscerated with Yellen’s testimony last week as volatility plunged back towards historically low levels. As shown in the chart below, the recent “back and forth” action which had reduced the overbought condition of the market short-term, was quickly reversed on Thursday and Friday. Furthermore, the high-level of complacency confirms a move higher from current levels could well be limited in terms of magnitude.
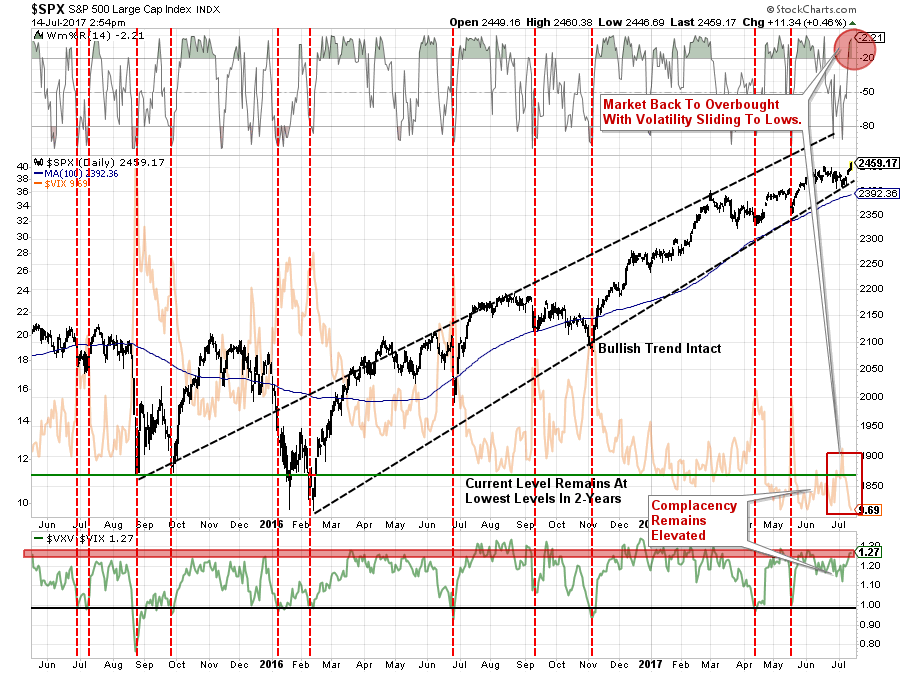
This abnormally low level of volatility continues to baffle market participants. The lack of “fear,” should be worrisome for investors, instead, it has almost become a “badge of honor.” I am just waiting for someone to print up a T-shirt that says:
“I survived the low-vol market of 2017 and lived to tell about it.”
There is one thing, as investors that we should be keenly aware of. Like everything in life, volatility runs in very large cycles. This is clearly shown in the chart below.
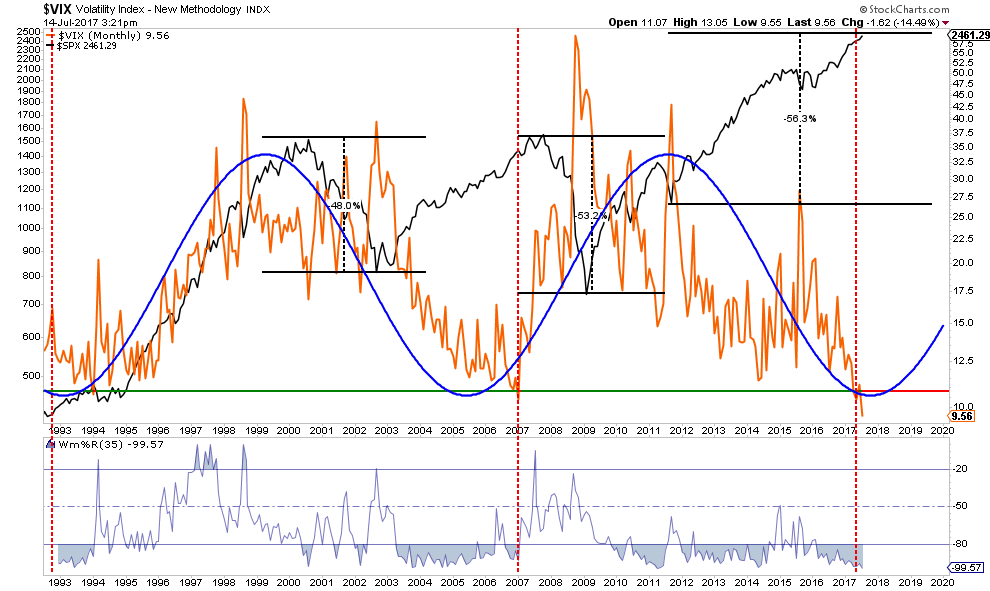
There are two takeaways from the chart above. The first is volatility is at the lowest levels since 1990. The second is we are likely on the cusp of a long-term trend change in the trend of volatility. That trend change will likely occur with the onset of the next mean reverting event in the financial markets. (Note: the chart above is monthly, so it is very slow moving.)
This is very important.
It doesn’t matter if you THINK you are diversified. As my partner, Michael Lebowitz, noted previously:
“The truth of the matter is that blind diversification does not work simply because it does not take into account the effects of volatility on asset prices. Chris Cole from Artemis Capital, one of the clearest thinkers on the importance of volatility as an asset class, highlights this point in the following graphic.”
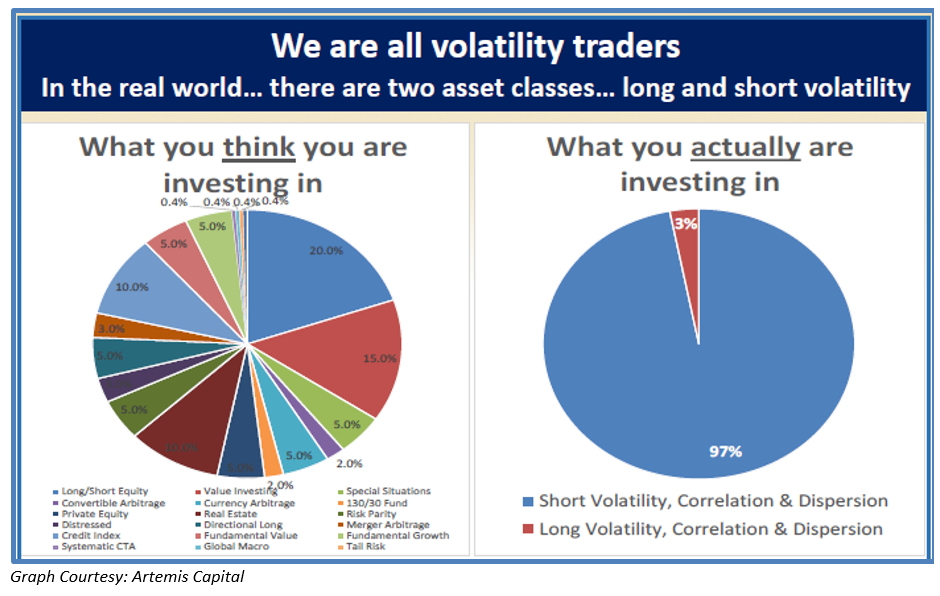
“Contrasting the perception of a well-diversified portfolio with the reality of embedded volatility, the graph reflects enormous concentration risk in short volatility. Importantly, this risk matters most at the exact point in time when one expects – hopes – their strategy of diversification will protect them. Unfortunately, the well-diversified portfolio (left side) turns into the short volatility-concentrated portfolio in periods of extreme market disruption. Mr. Cole’s analysis may be best summarized with the popular statement that correlations on many assets go to one during a crisis.”
Let’s put it this way. If you didn’t like what happened to your portfolio during the draw downs in 2016, just imagine what you will be feeling when a correction of some magnitude eventually occurs.
It is at this point when individuals stare into the ‘abyss,’ the realization of the ‘risk’ they have undertaken becomes most apparent. It is also when the mantra of ‘I bought it for the dividend’ changes to religion as the prayers are lofted for a ‘bounce to get out.'”
This is why I focus on risk and the inherent management of it. The returns will take care of themselves.
Confused?
This is a potentially confusing point for investors. How could we be talking about “risk” on one-hand, but looking for “opportunity” on the other? Good question. Let me explain.
Investors always make some fairly common mistakes in their portfolio management:
- They buy something without a target to sell (target gain or stop loss).
- They assume if they sell something they can never buy it again.
- If they sell something at a loss, it is now forbidden fruit.
- If they sell something at a gain, and it goes higher, they jump back in.
- By not selling a loser they don’t have to admit they were wrong.
- By not taking gains in winners, it confirms their “genius,” until it reverses to a loss.
- Etc., so forth, and so on.
These are all emotionally driven responses. Most bad habits of investors, individuals and professionals, revolve around their “ego.” This is particularly the case of professionals who ostensibly believe they are “smarter they the average bear.”
As a portfolio manager my job is actually very simple: Avoid major draw downs.
By doing just this one thing, you can literally outperform the market over the long-term.
- NO…you will not beat the market from one year to the next which is a stupid goal anyway.
- NO…you will not sell at the peaks and buy at the bottoms.
- NO…you will not have regular appearances on CNBC.
- YES…you will achieve your long-term goals.
The current market environment is NOT conducive to an overweight allocation to equity risk long-term. As I stated above, the risk-reward ratio is simply no longer in your favor.
By managing portfolio risk I can reduce the impact of the one thing that hurts long-term performance the most – losing capital.
See you next week.
Market and Sector Analysis
Data Analysis Of The Market and Sectors For Traders
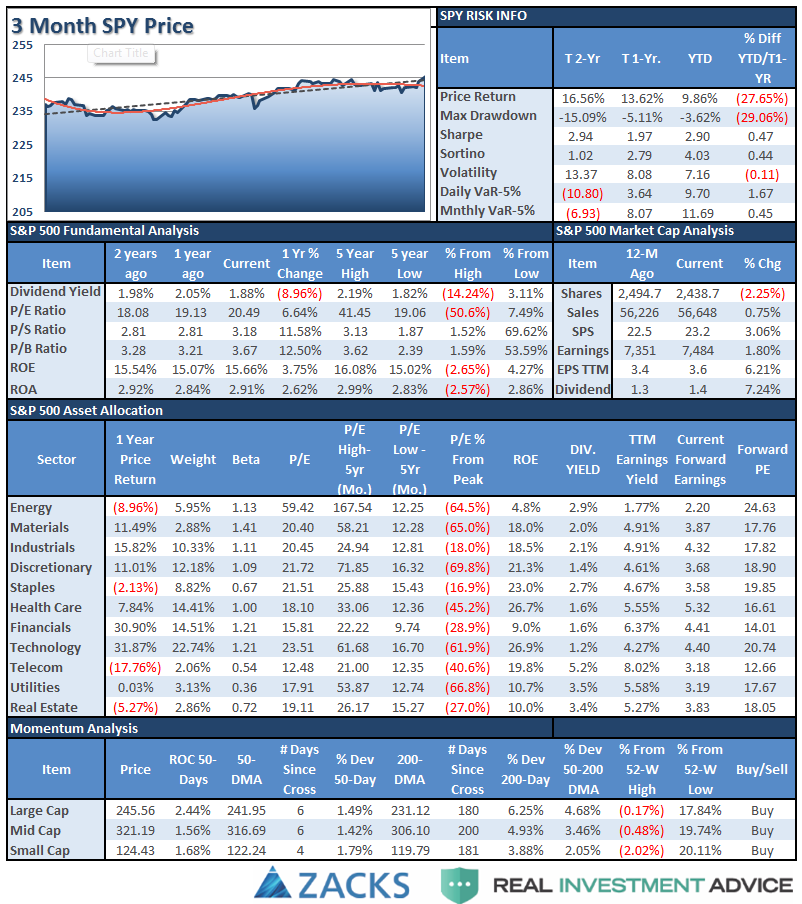
S&P 500 Tear Sheet
The “Tear Sheet” below is a “reference sheet” provide some historical context to markets, sectors, etc. and looking for deviations from historical extremes.
If you have any suggestions or additions you would like to see, send me an email.
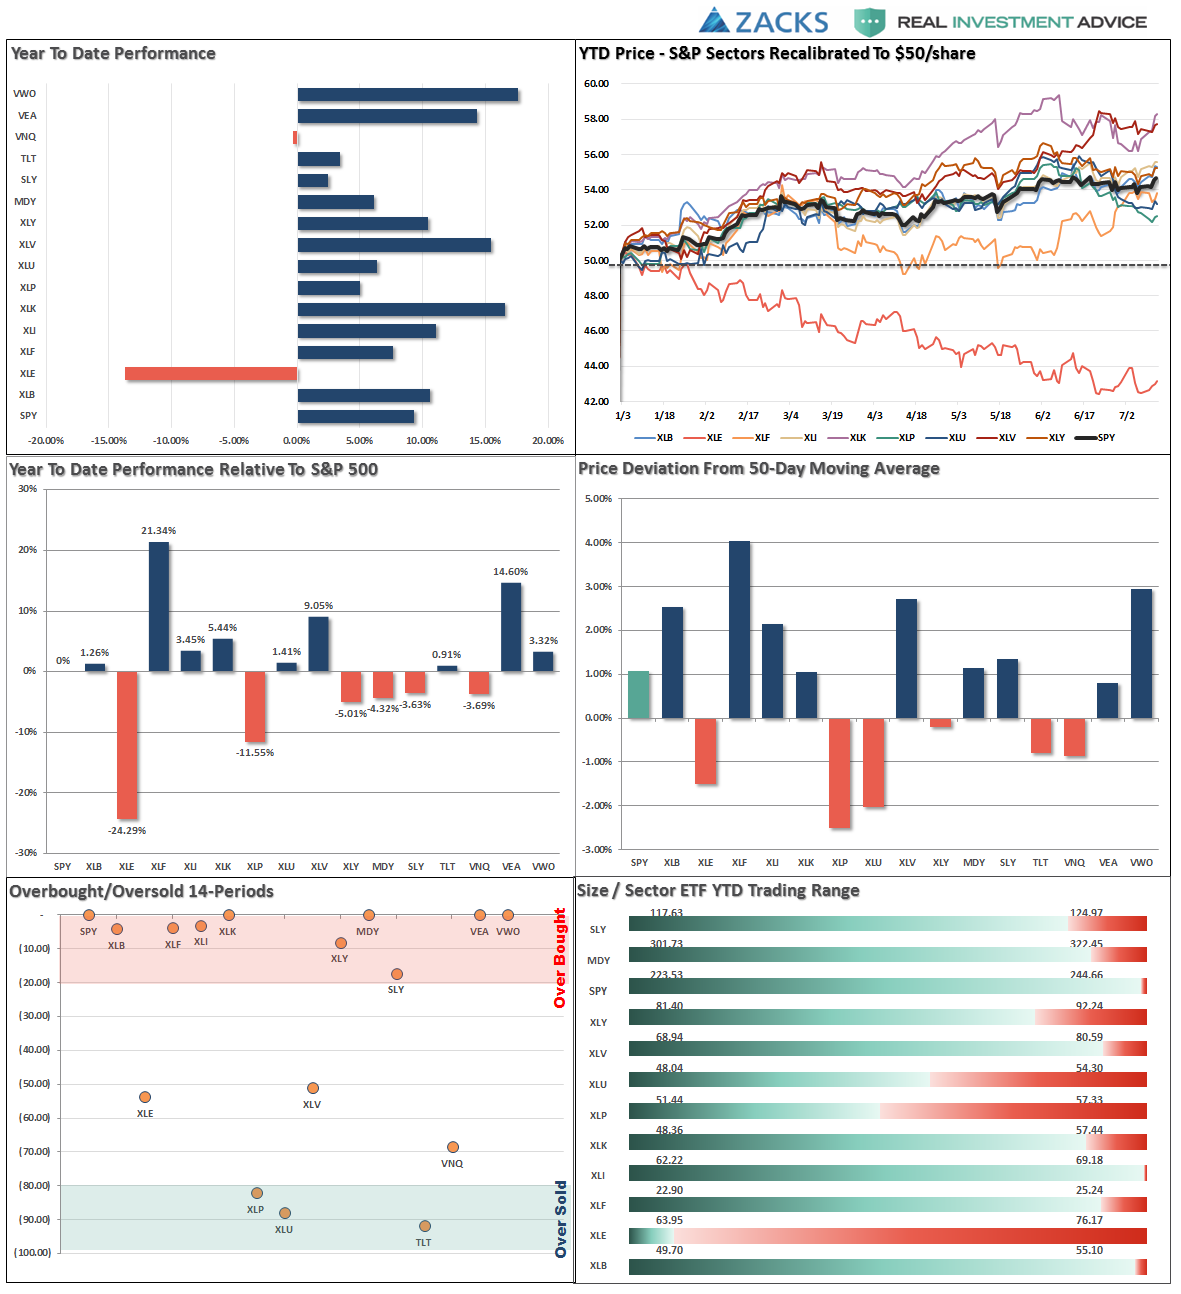
Performance Analysis
New! Thank you for all the comments on the performance analysis below. Due to many of the emails I got, I have swapped out the sector weight graph for a year-to-date performance range analysis. Keep the comments coming. (Email Me)
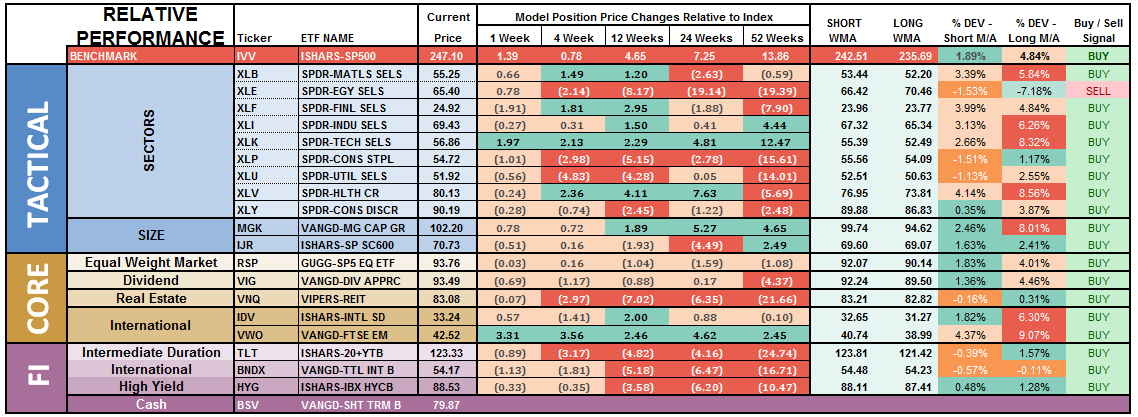
ETF Model Relative Performance Analysis
Sector Analysis:
Last week, we discussed some of the internal weakness that prevailed. Much of that was reversed this week as sectors recovered to regain their respective 50-dmas.
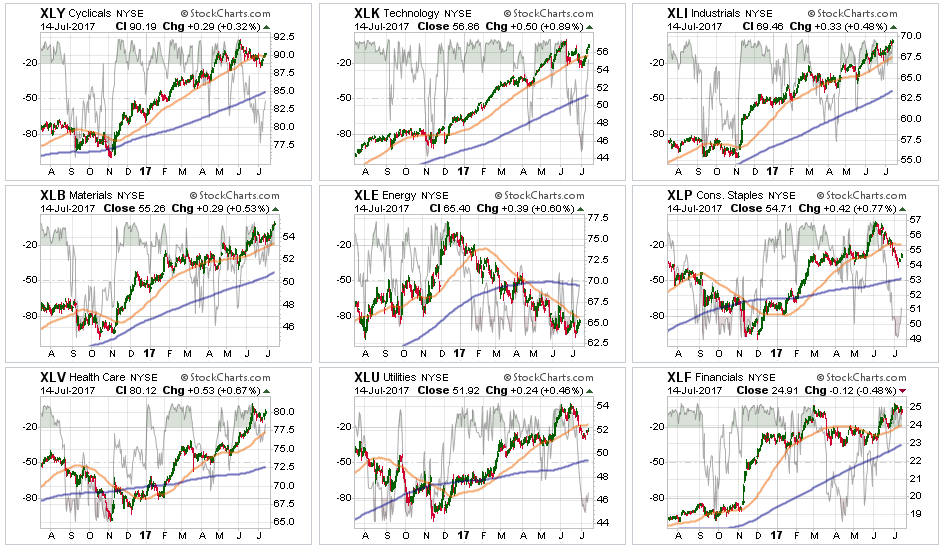
Technology, NYSE:Discretionary, Financials, Industrials, and Materials were the clear winners of the catch-up trade this week with each sector either reclaiming their 50-dma or setting new highs. Out of the group, Financials were the weakest as concerns over earnings rose.
Staples, Healthcare, and Utilities improved slightly and didn’t participate as strongly as its counterparts. Utilities and Staples, in particular, remain below their 50-dma, but are oversold and holding supports. Pay attention to these latter two for further deterioration.
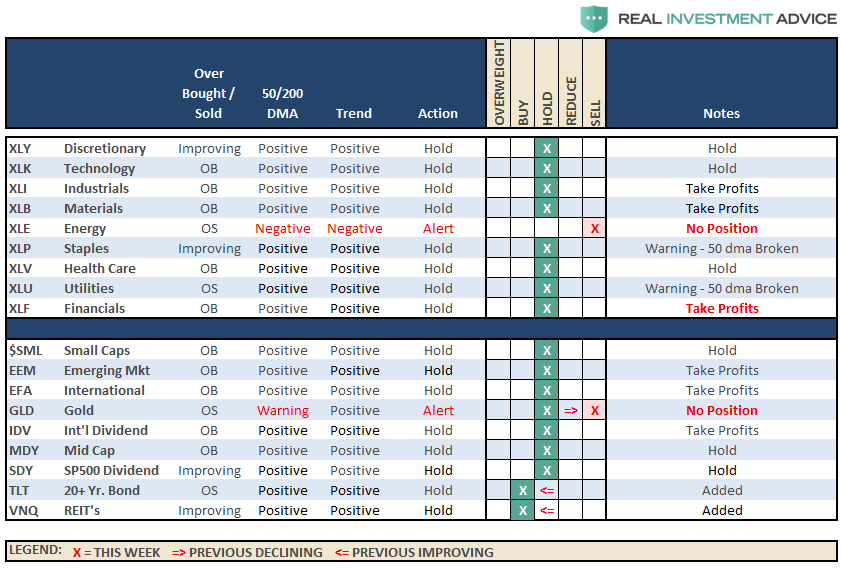
Energy – Oil prices rallied last week, as I discussed in the previous newsletter, but remain trapped below resistance. Furthermore, despite the rally in oil prices, energy stocks continue their downward trajectory. The major sector sell signal, and the cross of the 50-dma below the 200-dma, remains intact keeping us out of the space for the time being. Use any rally to reduce exposure accordingly until the technical trends improve.
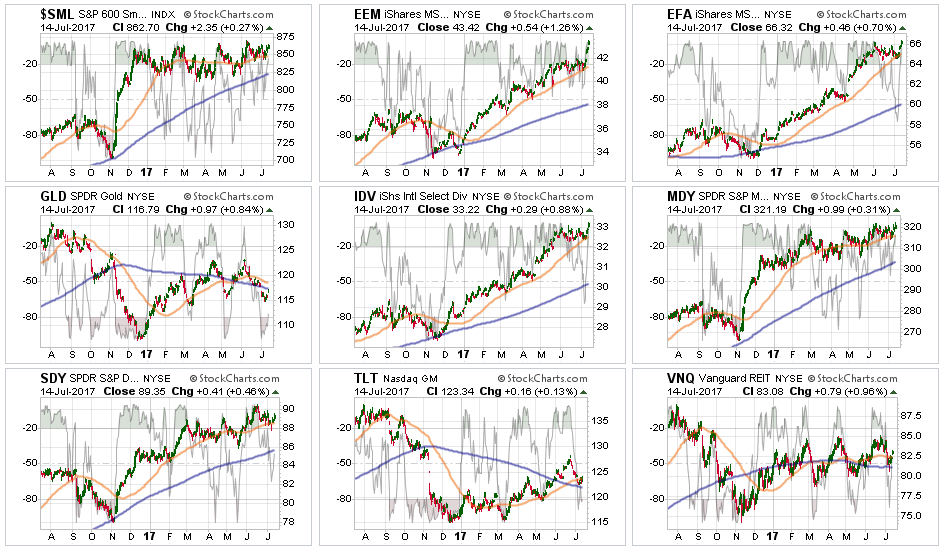
Small- and Mid-Cap stocks regained their respective 50-dmas which removes their warning signs but remained weak relative to the broader market. This keeps concern elevated at the moment, however, maintain exposure for now, but do so cautiously with stops at support.
Emerging Markets and International Stocks as noted last week and is worth repeating this week:
“There is a good bit of risk built into international stocks currently. We took profits a few weeks ago, but the recent extension suggests another round of rebalancing is likely wise. Take profits and rebalance sector weights but continue to hold these sectors but stop levels should be moved up to the 50-dma. A pull back to support will provide an opportunity to rebalance holdings in the short-term. The consolidation in industrialized internal markets is bullish and a potential point to add exposure may be approaching.”
That bullish “buy point” occurred this week, however, the explosion of these sectors higher reduces the opportunity somewhat. With the sectors extremely overbought, you can add exposure but do so cautiously.
Gold – The failure of the precious metal at critical resistance of 1300/oz keeping us out of our long-term positions currently. The short-term trading positions were also stopped out on the drop below $1260/oz for now. With Gold (via SPDR Gold Shares (NYSE:GLD)) back below the 50- AND 200-dma, we remain OUT of gold currently.
S&P Dividend Stocks (via iShares International Select Dividend (NYSE:IDV) and SPDR S&P Dividend (NYSE:SDY)), as noted last week:
“We have recommended previously taking profits in these sectors which now provides an opportunity to add exposure at a lower cost as this opportunity develops. Continue to hold current positions but maintain stops at the recent lows.”
Position weight can be added with the recent uptick.
Bonds and REITs were hit with the technical bounce in rates. As noted above, we have been waiting for a reasonable opportunity to add bond, and interest rate sensitive, exposure to portfolios opportunistically. We added bond exposure this past week and will look for further improvement to continue adding to portfolios.
The table below shows thoughts on specific actions related to the current market environment.
(These are not recommendations or solicitations to take any action. This is for informational purposes only related to market extremes and contrarian positioning within portfolios. Use at your own risk and peril.)
Portfolio Update:
The bullish trend remains positive, which keeps us allocated on the long side of the market for now. However, more and more “red flags” are rising which suggests a bigger correction may be in the works over the next couple of months.
Two weeks ago, during the correction, we added modestly to our core holdings for the second time this year. However, we are still maintaining slightly higher levels of cash currently.
With the breakout of the market on Friday, we are again adding to our portfolio positions and increasing exposure again this coming week. We also added to our bond holdings as well last week as rates hit our buy targets.
Stops have been raised to trailing support levels and we continue to look for ways to “de-risk” portfolios at this late stage of a bull market advance.
We remain invested. We just remain cautious and highly aware of “risks” to capital.
