European Stocks Look Really Bad…
Late last week stock markets around the world weakened and it seemed as though recent “Brexit” polls showing that the “leave” campaign has obtained a slight lead provided the trigger. The idea was supported by a notable surge in the British pound’s volatility.
Battening down the hatches…
On the other hand, if one looks at European stocks, one could just as well argue that their bearish trend is simply continuing – and likely would have continued regardless of the news backdrop. Ever since the Euro-Stoxx index fell below its 200-day moving average last August, the latter has served as resistance – and it is declining to boot:
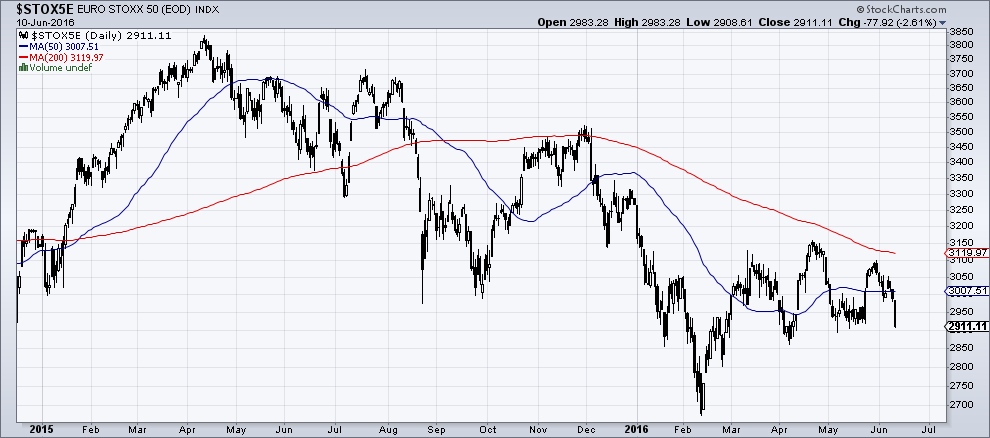
Euro Stoxx 50 Index – since falling below its 200 day moving average in August, it hasn’t managed to overcome it anymore – click to enlarge.
Compared to the strong rally in the US stock market since the February low, European stocks look extremely weak. Here is a comparison between the broader Euro-STOXX 600 Index and the S&P 500:
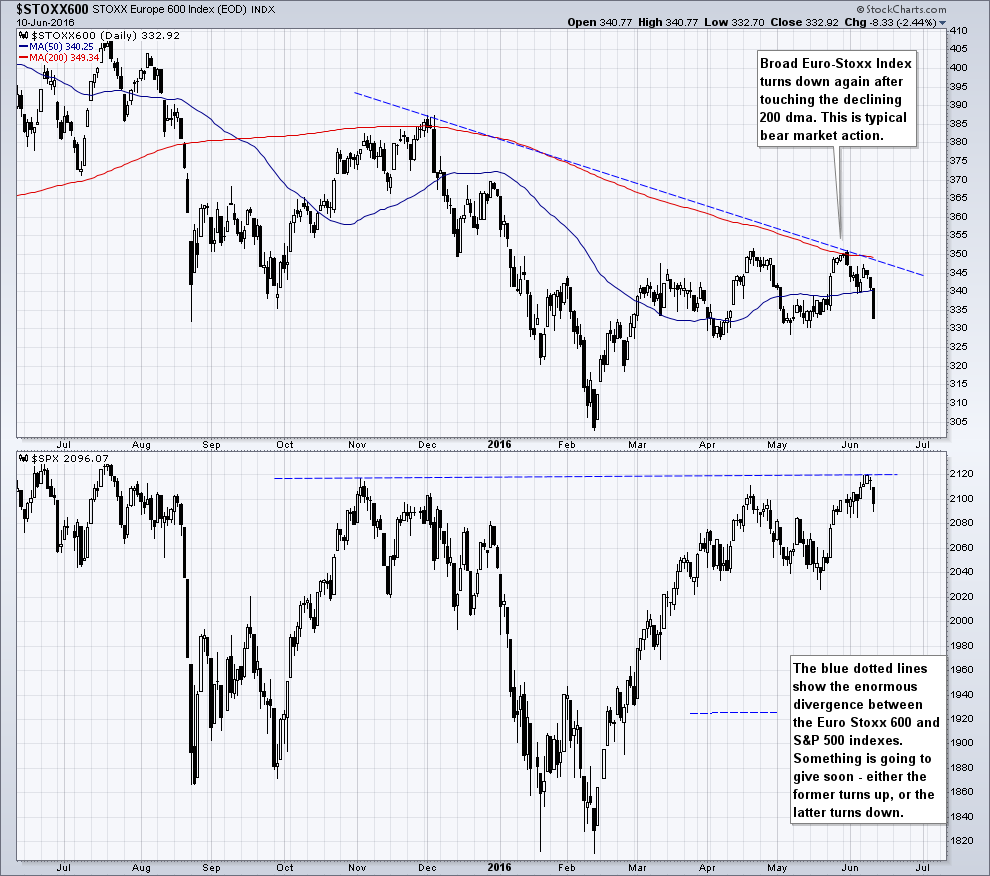
Euro Stoxx 600 compared to SPX – this is quite a big divergence, something is ergo likely to give soon.
Apart from the unreliability of the polls – there are still way too many undecided voters – we actually believe the world will keep turning in the event the “leave” campaign wins. If the pound and stock markets continue to weaken prior to the referendum, they will probably recover thereafter, possibly regardless of the outcome. This is strictly a short term view though.
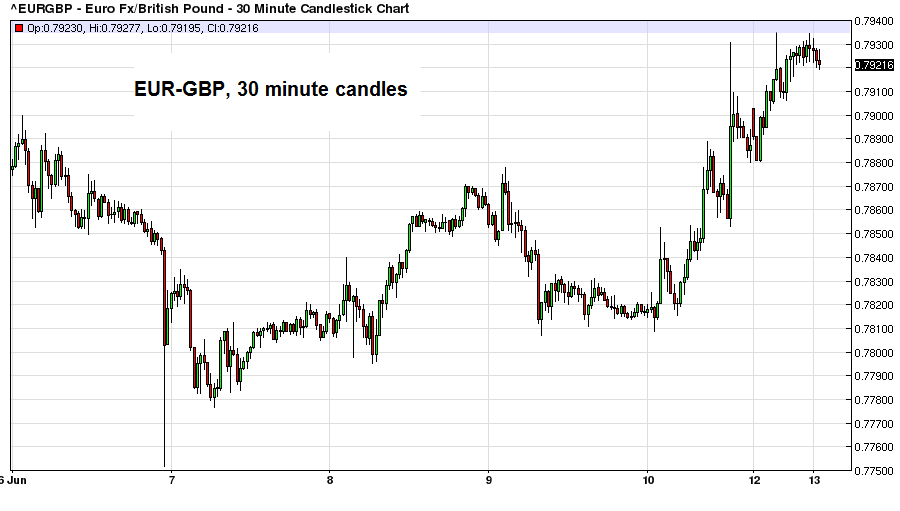
EUR/GBP over the past week. Even the euro is rising against the pound, although the logic of this escapes us (the question is: who needs whom more?)
We guess that what worries market participants most is the idea that a British exit from the EU could encourage others to wave good-bye to Brussels as well (this is akin to “implied odds” in poker). In that case, the carefully constructed bailout edifice may come into question again. After all, the exercise depends primarily on confidence (namely confidence that the contingent liabilities governments have amassed won’t actually materialize on their balance sheets).
European Bank Stocks Crushed Again
One market sector in Europe that continues to look truly awful are bank stocks – which is in keeping with the above mentioned gloomy possibilities. Readers no doubt recall that the sovereign debt crisis in euro land hit banks quite hard. This was no surprise, since banks are deeply intertwined with the fortunes of the State and its debt securities, particularly in a centrally planned fiat money system.
In this particular case, many banks were hit by the double whammy of expiring property booms and plunging government bond prices. Numerous European banks were also speculating in all sorts of nifty new products that looked like free money to them – for a while, anyway (with activities ranging from trading structured credit products to writing CDS).
To paraphrase Milton Jones, it was as if a colonic irrigation clinic had first been hit by a hose pipe ban and shortly thereafter by a giant mudslide. Last time we looked, legacy NPLs in the euro area as a whole were still close to €1 trillion (the number has reportedly slightly improved in the meantime). The combination of much stricter capital requirements, the ECB charging a penalty rate on reserves and little credit demand makes it difficult for banks to inflate themselves out of their predicament (the method usually employed in the past).
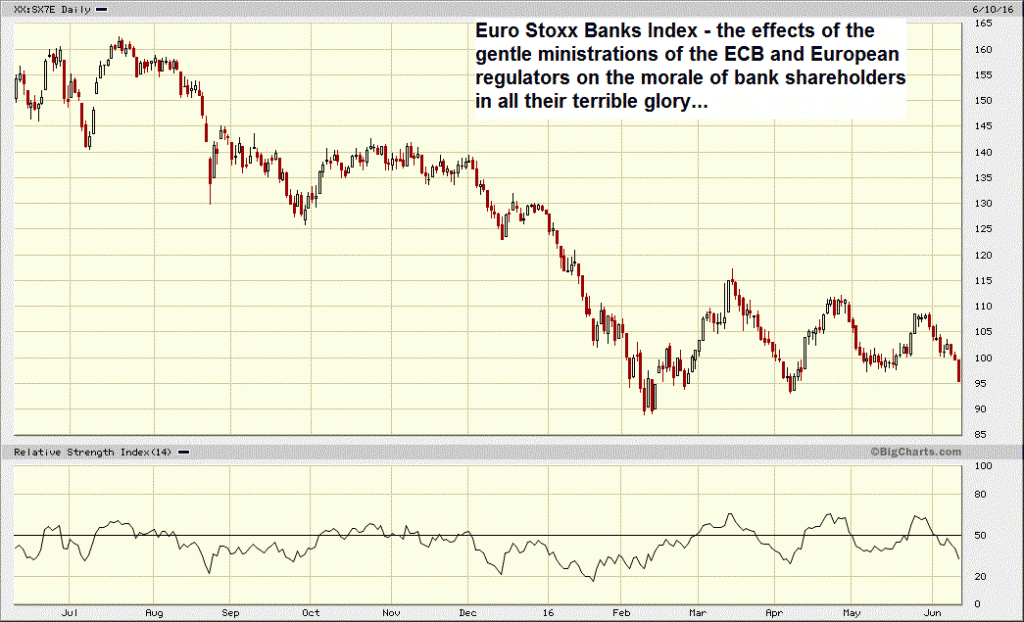
EURO STOXX Banks index – seemingly a one way street
Looking at a longer term chart of the European bank index, one can see that prices are actually approaching the crash lows of 2009 and 2012 again. Right now, there is no obvious crisis situation (yet), so the weakness may partly be due to the fact that earnings growth at European banks has been mainly conspicuous by its absence, and no-one believes it will make a comeback anytime soon.
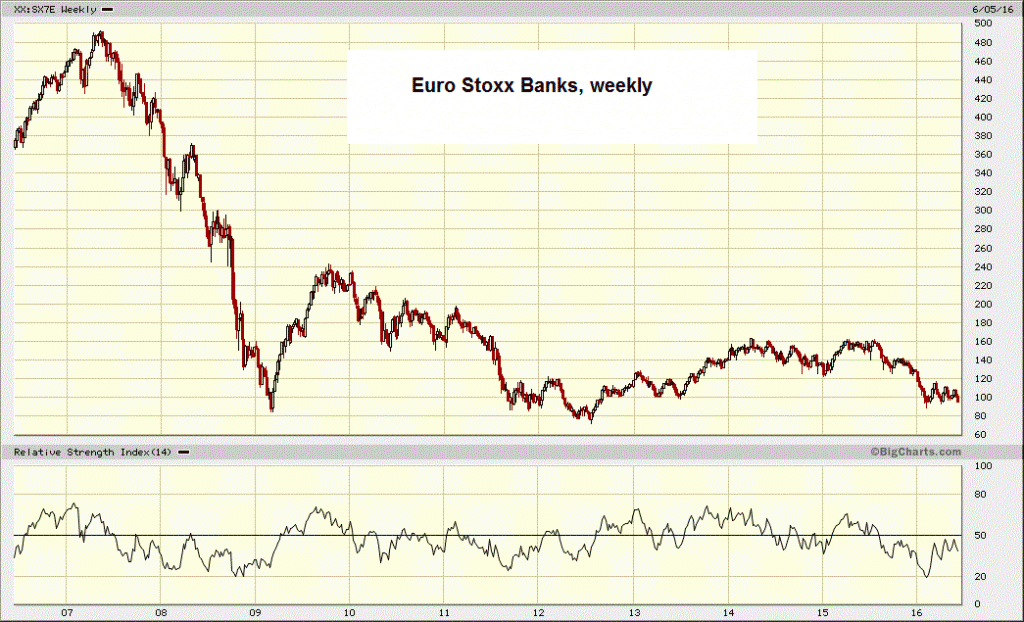
Euro Stoxx bank index over the past decade. This very ugly…even the Nikkei has been more fun over the past 25 or so years.
We find it interesting that this development has so far failed to elicit much comment in the mainstream financial press. Is no-one wondering about this? Isn’t it considered newsworthy that European bank stocks are stumbling back to the worst levels seen during the crisis?
We are not 100% sure what exactly the market is trying to tell us here. There are a number of possibilities, but only one of them is a good one – namely the possibility that the market will turn out to be wrong. Of course the previous lows in the index also represent strong support, which seems more likely than not to hold. However, it would obviously be pretty bad if it were to break.
US Stock Market – Serenely Sailing in the Clouds
For some reason, investors (we use the term loosely) have decided that the US stock market deserves to dwell in an entirely different universe. We could provide a long list of arguments as to why this seems absurd, but most readers are probably aware of those.
The question we want to ponder is whether this can last. In the near term there are signs that things could become a little more “interesting” in coming days and weeks. Last week there was an unusually large surge in the VIX (especially on Friday) – which ended the week right at a lateral resistance level. SPX puts were apparently in demand in spite of the fact that the index itself didn’t move much.
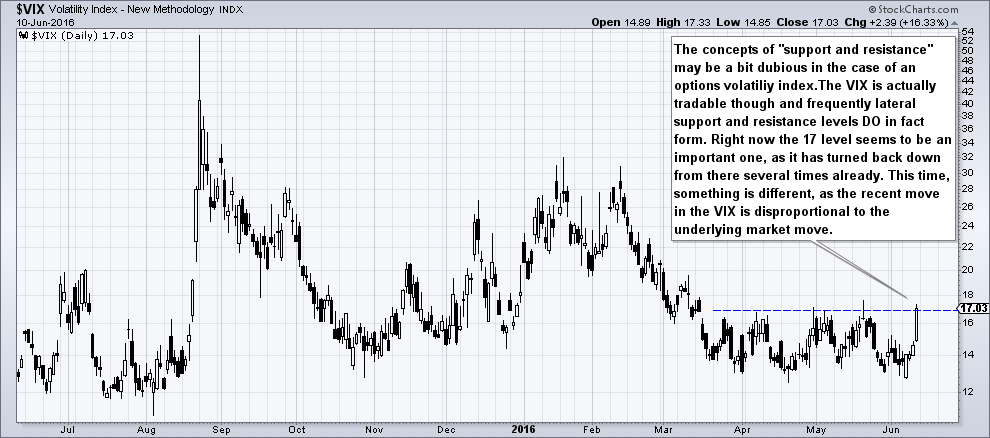
The CBOE Volatility Index jumped quite a bit last week, although the stock market barely corrected .
The VIX should be watched closely, due to the activities of funds employing certain systematic trading/ investment strategies. In recent years quantitative strategies have attracted huge amounts of money – with the result that their trading activities can have enormous influence on short term market moves.
Some of these strategies are in fact taking cues from volatility. The lower the VIX, the more money they will allocate to equities; conversely, they will tend to sell stocks when it rises. Other strategies are relying on certain inter-market correlations (such as that between stocks and bonds) and of course there are also trend followers such as CTAs. All these strategies can receive cues from each other sometimes, with one thing leading to another and exacerbating market moves.
This has e.g. happened during the options expiration week of August 2015 and the following Monday. On that occasion a trigger event was simmering in the background as well, namely yuan weakness and worries about the decline in China’s forex reserves. So it seems a good idea to keep an eye on the VIX (as well as on certain currencies, such as the yen and the yuan).
Note also, while the broader market as represented by the NYSE Index (NYSE Composite), has made it back to the levels in November prior to the January sell-off, it hasn’t come close to the levels of last summer – contrary to the S&P 500. It has now turned down from this fairly obvious resistance level:
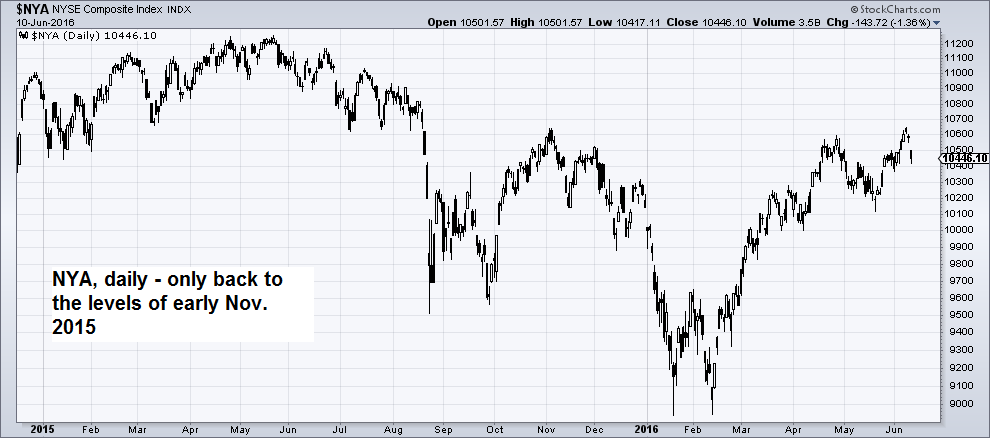
NYA – turning down after testing the November 2015 high .
Incidentally, the yuan has weakened again, the yen has been quite strong lately and gold continues to move in lockstep with the yen (we’ll discuss gold separately soon). There is very little focus on the yuan right now, but that could change again. Strength in the yen meanwhile is usually associated with weakness in “risk” assets, but that correlation is not necessarily set in stone (the strong yen is definitely still going hand in hand with weakness in the Nikkei though).
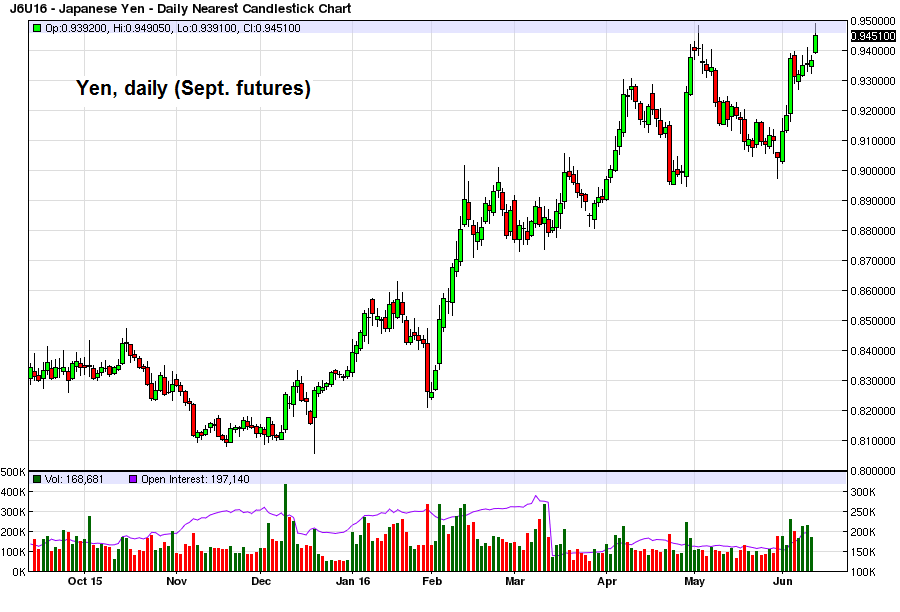
The yen continues to be strong.
Conclusion
All the ingredients for a further surge in market volatility seem to be present right now. Usually June is a rather uneventful month, but this year it could well be different.
