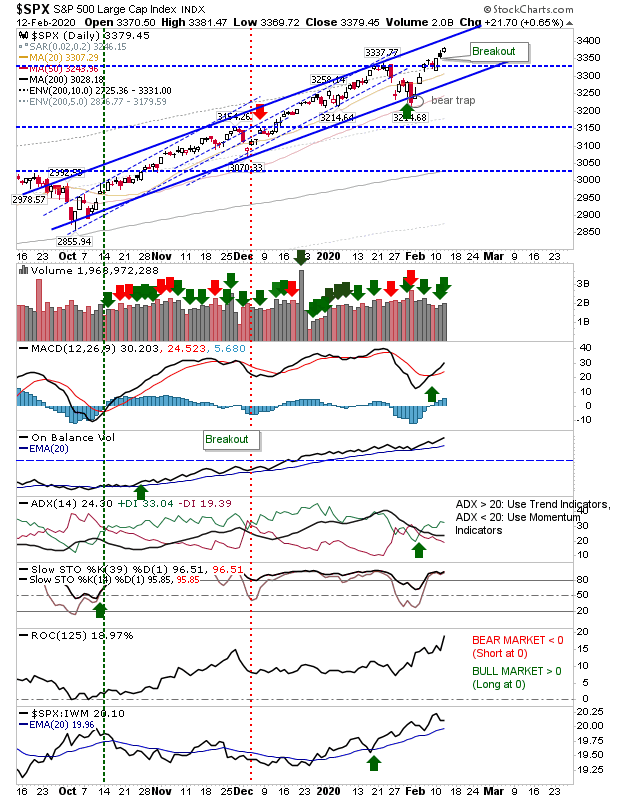
TheS&P 500 extended its move above 3,330 resistance on higher volume accumulation yesterday. There is still room to run to channel resistance on net bullish technicals.
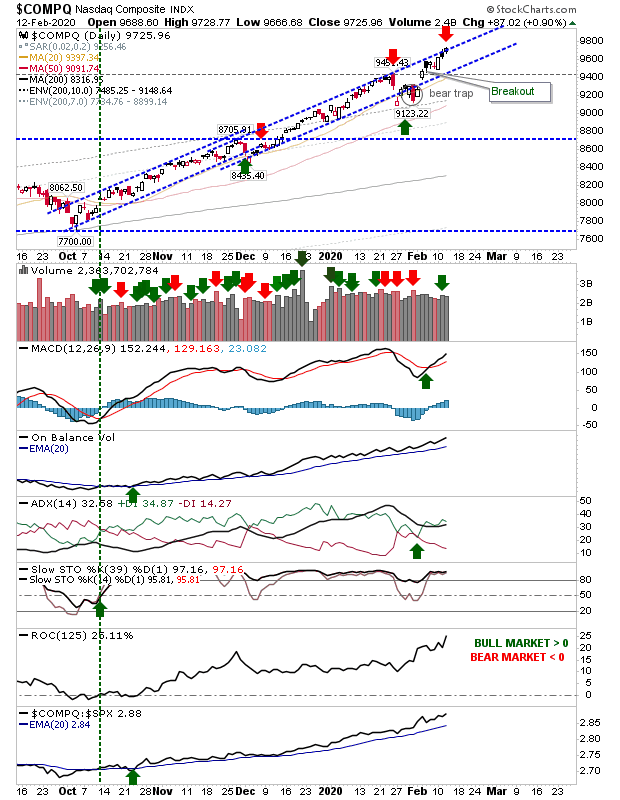
The NASDAQ similarly added to its breakout, extending to channel resistance with a bearish black candlestick. Aggressive shorts can look for an opportunity here, but similar plays in December and January both stopped out.

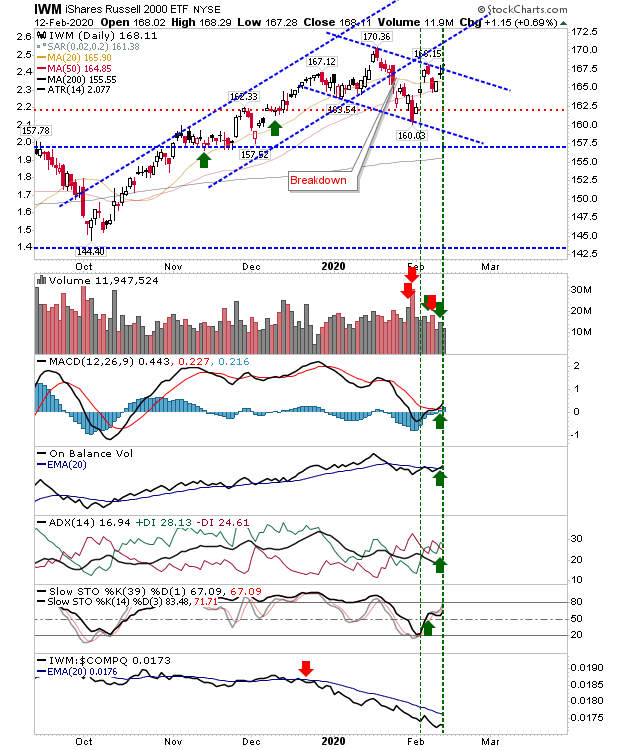
The Russell 2000 (via iShares Russell 2000 ETF (NYSE:IWM)) is running in downward channel but now finds itself testing resistance with a return to net bullish technicals. Given the technical picture I would look for a channel breakout—helped in part by strength in the NASDAQ and S&P.

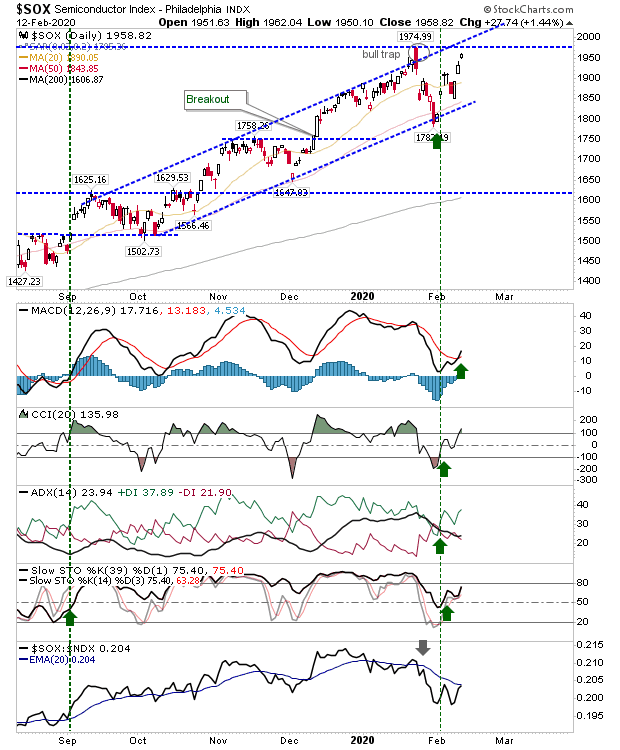
Semiconductors have also come back strong after recovering from the January 'bull trap.' The bounce off the channel is approaching resistance defined from the 'bull trap,' but does so from a picture of net bullish technicals—all of which have room to run before turning overbought.

Given the sequence of small gains and the proximity of resistance for many of these indices, I would be looking for a few quiet days to consolidate gains and prepare for a larger move higher. Value players may focus on Small Cap stocks playing 'catch up' with Large Cap stocks.
