Before we talk about silver and the metals, here is a line from the weekend Daily:
In Transportation IYT, Friday’s bearish candle and breakdown back into a caution phase gives us two very reliable patterns to watch.
IWM must hold 167 and IYT must get back over and close above 195.51.
The Russell 2000 or iShares Russell 2000 ETF (NYSE:IWM) did hold 167. With Friday’s low, 167.34, it even managed to hold that level.
Transportation, via iShares Transportation Average ETF (NYSE:IYT) could not clear back over the 50-DMA or 195.61. However, IYT closed green.
So, even with all the continuing news from China, the belief that the market won’t quit persists.
However, since stagflation is a word I kick around a lot, the move in the metals and bonds got me thinking…

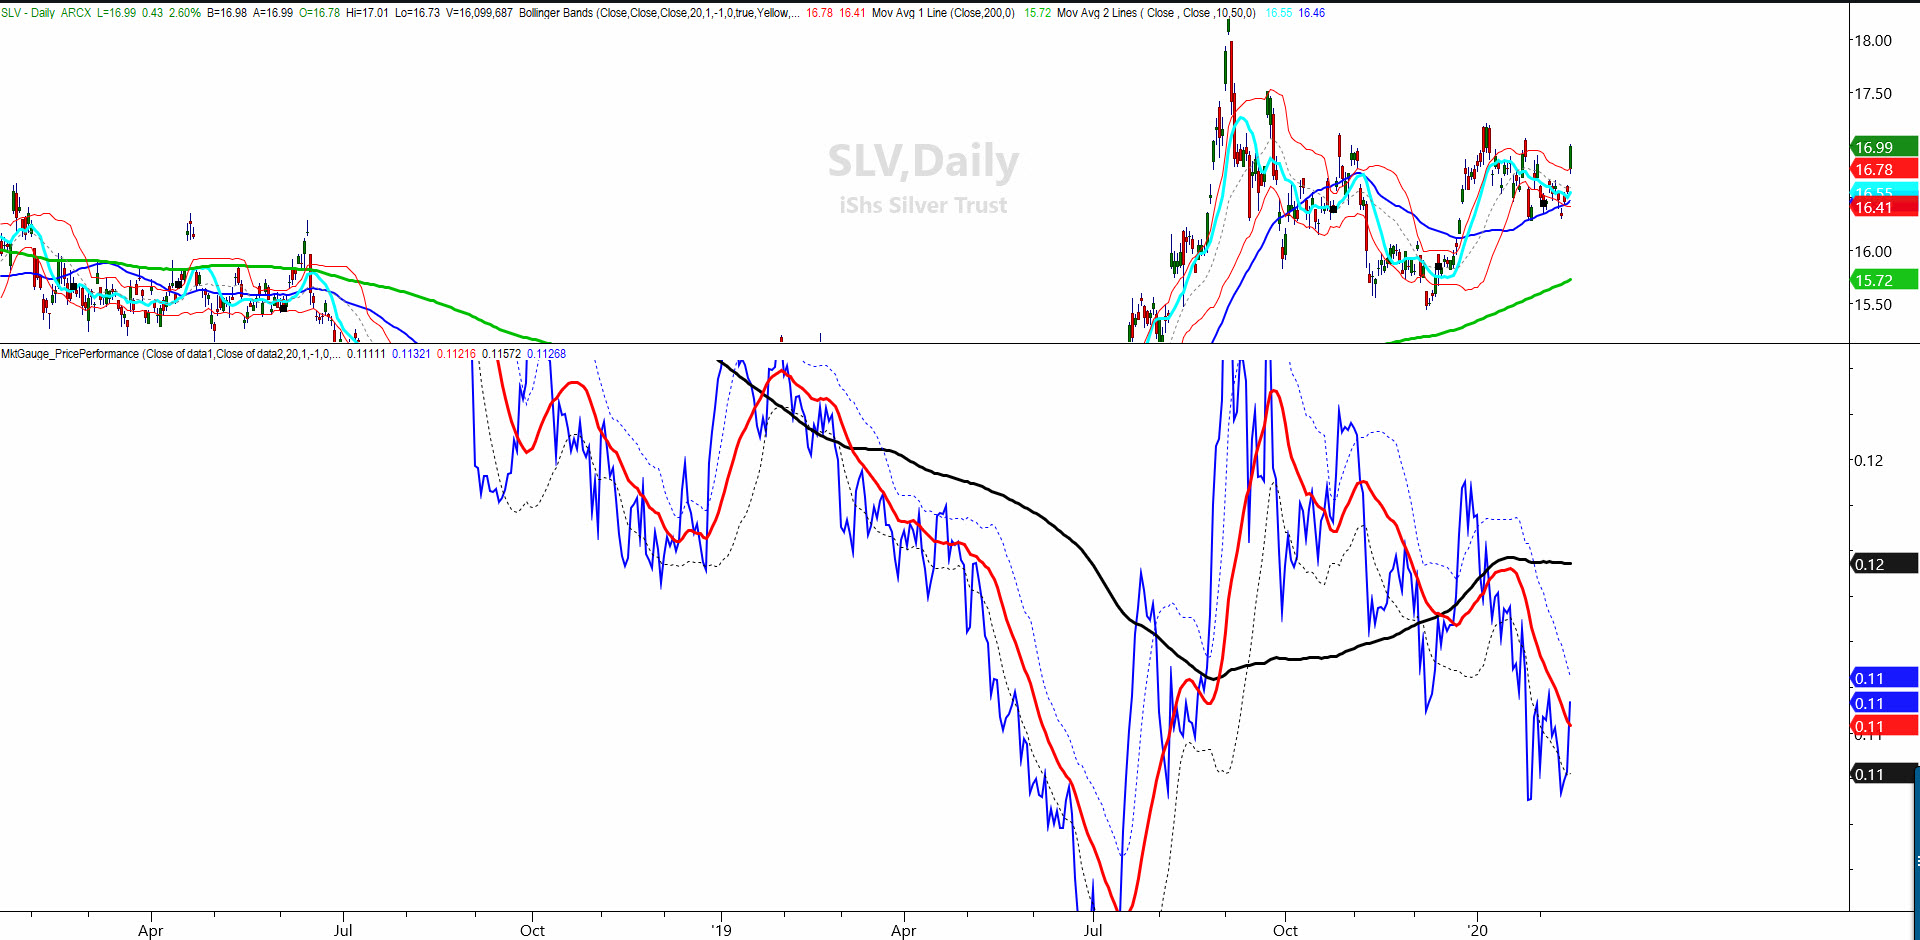
The top chart is iShares Silver Trust (NYSE:SLV), the silver ETF. The bottom chart is the ratio between silver and gold.
Yesterday, gold saw levels it has not seen since 2013. And gold miners finally took out the trading range of the last 10 trading days.
Silver crossed the shorter-term moving average (red) that suggests the possibility it will start to play some serious catch-up to gold. The silver chart on top also represents the breakout after a similar period of consolidation, just like the miners.
What does the action in equities and the metals imply? Interestingly, the metals have help from the low bond yields.
Yet they are ignoring the strong dollar. In a stagflationary environment, the dollar would weaken, as would stocks, while gold, silver, miners and some soft commodities would strengthen.
Remember sugar as the secret weapon to determine if inflation is coming? Well, that has moved up a lot, so yesterday's metals move is yet another cautionary tale to equities bulls.
Furthermore, as stagflation is barely mentioned in the financial media, should that sentiment change, bonds—typically safe when stocks turn down—will not look good.
S&P 500 (SPDR S&P 500 (NYSE:SPY)) 334.67 the 10-DMA held. SPY in La La Land.
Russell 2000 (IWM) 166.87 the 10-DMA held.
Dow (SPDR® Dow Jones Industrial Average ETF Trust (NYSE:DIA)) Closed right on its pivotal support
NASDAQ (Invesco QQQ Trust (NASDAQ:QQQ)) Talk of La La Land-new all-time high today. 231.67 support to hold
SPDR® S&P Regional Banking ETF (NYSE:KRE) (Regional Banks) 56.12 resistance and 54.05 major support
VanEck Vectors Semiconductor ETF (NYSE:SMH) (Semiconductors) Gapped lower but held support at 148.00
IYT (Transportation) Confirmed caution phase. 195.61 to clear or the bulls should be careful
iShares Nasdaq Biotechnology ETF (NASDAQ:IBB) (Biotechnology) 123.48 the number to clear
SPDR® S&P Retail ETF (NYSE:XRT) (Retail) Looks better on the weekly chart so has to clear 45.24 on the daily one
Volatility Index (iPath® Series B S&P 500® VIX Short-Term Futures™ ETN (NYSE:VXX)) 14.20 is the first area of interest
