Although most major EU indices closed in the red yesterday, appetite improved during the US session, following an outline of US President Joseph Biden’s infrastructure proposal, detailing a 2.3trln worth of investments.
As for today, we have an OPEC+ meeting, but we don’t expect any action. We believe that the Cartel and its allies will roll over their current supply curbs into May.
Equities Gain On Biden's Spending Plan, OPEC+ Decides On Output
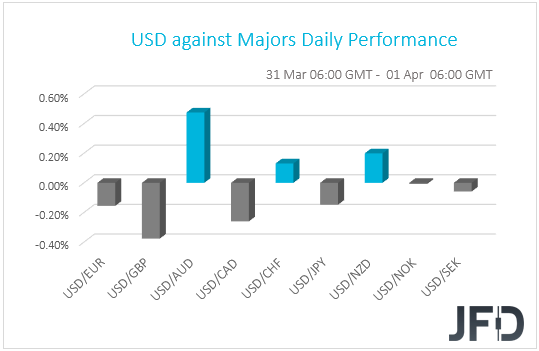
The US dollar traded mixed against the other G10 currencies on Wednesday and during the Asian session Thursday. It gained versus AUD, CHF, and NZD in that order, while it underperformed against GBP, CAD, EUR and JPY. The greenback was found virtually unchanged versus NOK and SEK.
Although the performance in the FX sphere does not paint a clear picture with regards to the broader market sentiment, the weakening of the risk-linked Aussie and Kiwi suggests that markets may have traded in a risk-off fashion.
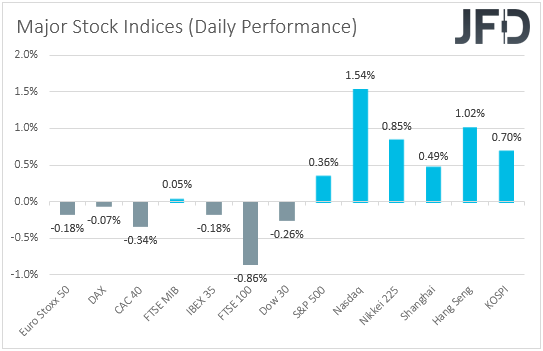
Indeed, most major EU indices closed in negative territory, but appetite improved during the US session, with NASDAQ gaining the most and the S&P 500 hitting a fresh record high. Dow Jones failed to gain and ended its trading 0.26% lower. The optimism rolled over into the Asian session today.
It seems that the catalyst behind the improvement in investors’ morale may have been an outline of US President Biden’s infrastructure proposal, released by the White House and detailing a USD 2.3trln worth of investments. Biden presented his plan in a speech later in the day.
That said, the plan also included tax-increases on corporate income from 21% back to 28%, but investors seem to have been focused on the intentions to boost the economy. What’s more, reports said that the size of the plan could further increase to USD 4trln as additional parts are announced.
The proposal comes less than a month after Congress passed a USD 1.9trln package of COVID relief spending, and it remains to be seen whether it will also get through. Although this is good news for the economy and it seems to be a supportive development for equities, it would be interesting to wait and see whether this will revive fears of an overheating economy.
If so, this could lift US Treasury yields higher and perhaps weigh again on equities. However, we don’t believe that we will see a strong sell-off, if any. We stick to our guns that the stock market is likely to continue trending north, and any potential setback may offer new buying opportunities.
We repeat for the umpteenth time that with the Fed noting that inflation will meet their goal in the years after 2023, and clearly signaling that there are no discussions about normalizing monetary policy, investors may feel confident to continue increasing their risk exposures.
As for today, we have a meeting between OPEC and major non-OPEC members, known as the OPEC+ group, where they will decide on output production. Growing concerns about global demand due to a resurgence of COVID infections has been weighing on oil prices recently and thus, we see the case for OPEC and its allies to roll over their current supply curbs into May.
This, and further improvement in market sentiment in the foreseeable future, may bring an end to the corrective phase in oil prices.
EURO STOXX 50: Technical Outlook
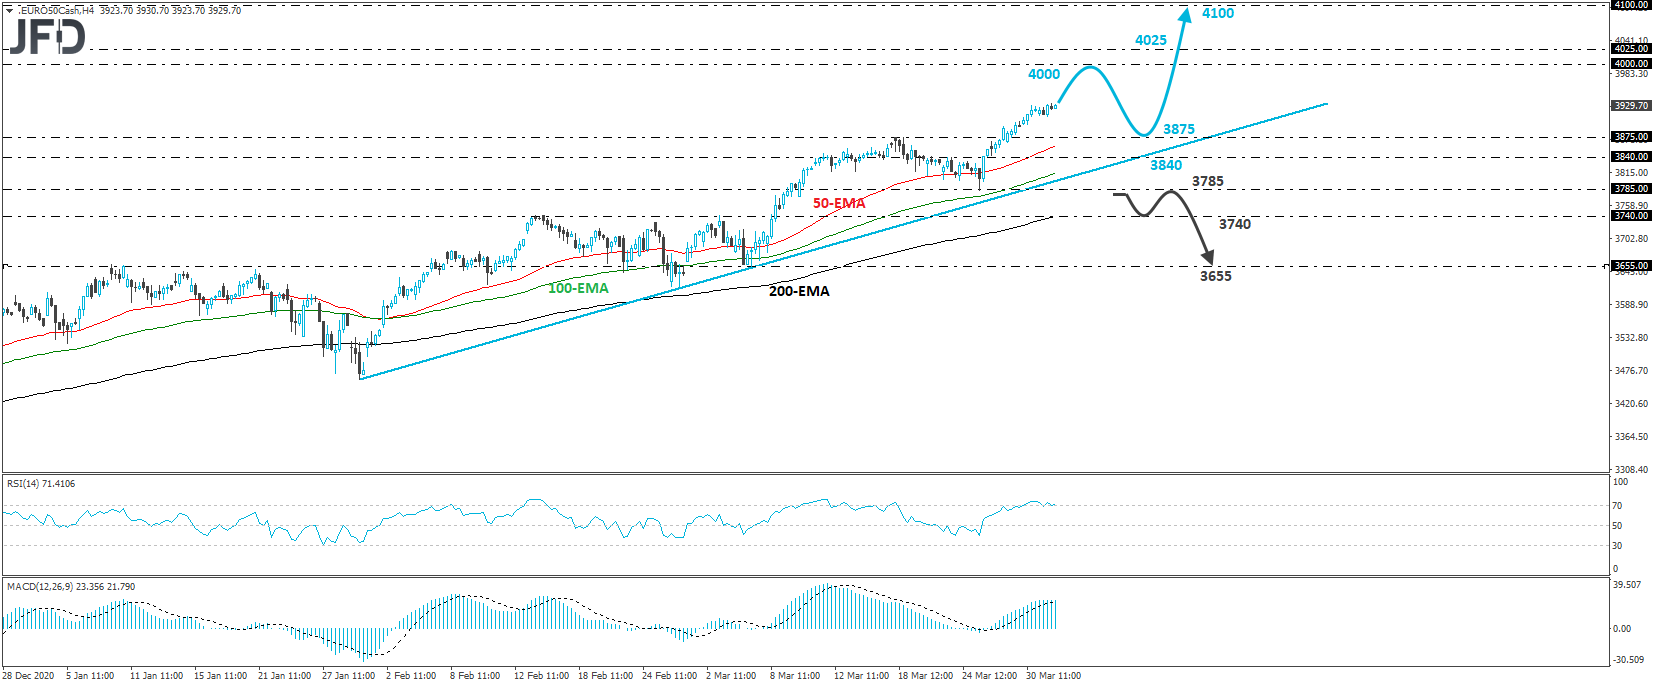
Euro Stoxx 50 has been in a rising mode since Mar. 25, when it hit support at 3785, slightly above the upside support line drawn from the low of Jan. 29. The next day, the index broke above the peak of Mar. 18, at 3875, thereby confirming a forthcoming higher high.
With all that in mind, we will stay positive with regards to the near-term outlook. We believe that the bulls are likely to stay in the driver’s seat and perhaps push the price up to the psychological round number of 4000, or to the 4025 area, marked as a resistance by the inside swing low of August 2007. If neither barrier is able to halt the advance, then we may experience extensions towards the 4100 territory.
In order to abandon the bullish case and start examining a short-term bearish reversal, we would like to see a clear dip below 3785. The index would already be below the aforementioned upside line and the bears may initially target the 3740 territory, marked by the inside swing highs of Feb. 15, 16, and Mar. 3. Another break, below 3740, could carry larger bearish implications, perhaps setting the stage for the 3655 zone, defined as a support by the lows of Mar. 4 and 5.
Brent Oil: Technical Outlook
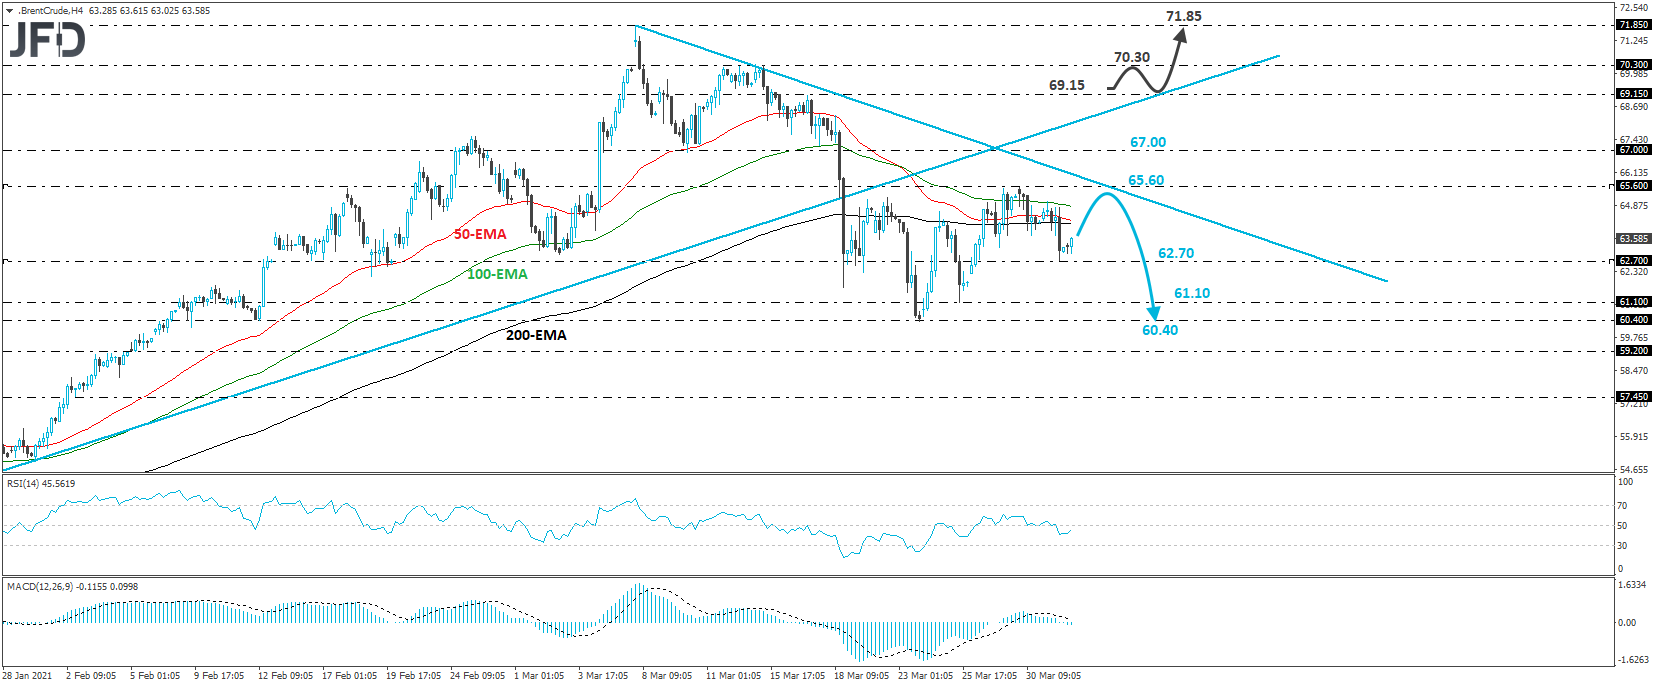
Brent crude traded lower yesterday, hit support at 62.70, and today, it rebounded somewhat. Overall, the commodity has been trading in a trendless mode since Mar. 18, but remains below the prior upside support line taken from the low of Nov. 2, as well as below a short-term downside one drawn from the high of Mar. 8.
Although we expect the oil to turn bullish at some point in the foreseeable future due to further improvement in the broader market sentiment, the aforementioned technical signs suggest that another slide may be possible in the very short-term.
The current rebound may continue for awhile more, but the bears may decide to take charge again from near the 65.60 zone, marked by Tuesday’s high. This may result in another slide towards the 6270 territory, the break of which may open the path towards the 61.10 barrier, marked by the low of Mar. 25, or towards the 60.40 obstacle, marked by the low of Mar. 23.
The outlook may turn bullish again if we see a decisive break above the 69.15 area, marked by the high of Mar. 17. Brent would already be above both of the aforementioned diagonal lines and the bulls may initially aim for the 70.30 zone, which provided decent resistance between Mar. 11 and 15. Another break, above 70.30, may extend the advance towards the peak of Mar. 8, at 71.85.
As For The Rest Of Today's Events
We have the final Markit manufacturing PMIs for March from the Eurozone, the UK, and the US, which are expected to confirm their preliminary prints, as well as the US’s ISM manufacturing PMI for the month, which is anticipated to increase to 61.3 from 60.8, underscoring the fast recovery of the world’s largest economy.
US initial jobless claims for last week are also coming out and the forecast points to a small decline, to 680k from 684k.
As for the speakers, we have two on today’s agenda and those are Philadelphia Fed President Patrick Harker, and Dallas Fed President Robert Kaplan.
