Last month, I wrote a piece about Warren Buffet’s favorite stock market metric and how it was signaling huge losses ahead.
If you haven’t read it yet – you can here. It’s even more relevant today.
And though Buffet’s favorite market indicator’s signaling huge danger ahead for investors – he just recently preached that stocks are still attractive.
This seems rather contradictory if you ask me. . .
Even though his favorite market value metric is at an all-time high – more so than during the DotCom bubble and Housing bubble. And with the S&P 500, NASDAQ and Dow Jones Index at record levels – Buffet’s still recommending stocks.
But, here’s the best part: he went on to say that he believes there will be another stock market crash eventually.
So, why does he talk about buying stocks when he’s expecting a coming crash?
His reasons are pretty simple: investors can’t time when the market will crash. So instead of sitting on the sidelines – waiting and missing the upside – just buy now. And when market prices do crash eventually – which he acknowledges they will – you can simply buy more at lower prices (also, he adds, compared to bonds – stocks are more attractive).
I kinda-sort-of agree with him. It’s not the best idea to try and time a market crash, as many value guys call it a ‘fools errand’.
There’s always that one person (we all know them) who thinks they will sell out right before prices collapse. But in reality, it never works out that way.
History’s littered with the corpses of investors and the hedge-funds that thought they could do this.
So instead of trying to time things accurately – just measure the potential risk and reward.
The mainstream finance media and ‘modern portfolio theorists’ (MPT) tell us that risk and reward is symmetrical (mirrors each other).
What this means is; the less risk you take – the less reward you get. And the more risk you take, the more reward you get. Or simply put – low risk, low reward and high risk, high reward.
There are many problems with this model – far too many for me to cover in this article. But the takeaway is that you need to find asymmetric opportunities instead.
I summarize asymmetry in two ways:
1. Positive Asymmetry – low risk; high reward
2. Negative Asymmetry – high risk, low reward
And thanks to former-trader-turned-risk-philosopher Nassim Taleb and Mark Spitznagel – head of Universa Funds – we learned about ways to position our portfolios that minimize risk when markets get fragile.
Mark Spitznagel, for instance, famously uses the tactic called ‘tailhedging’.
Tailhedging is when you protect your portfolio from sudden ‘black swan’ events and market corrections. An example is to go long a stock but also buy a small amount of long-dated, put options on the same stock. This way, if the stock you bought suddenly crashes – your put options will soar in value – offsetting losses from a declining share price.
Using this strategy, Spitznagel made headlines when his fund profited over $1 billion (a 20% increase) in one day during the August 15th 2015 ‘Dow Collapse’.
Mark Spitznagel’s very critical of modern portfolio theory, and how ‘buying high’ is detrimental to long-term compounded returns (you can read his white papers at his site here). In his view, the higher prices go – the riskier things get.
When investors pay top dollar for assets today, and then over the next few years prices collapse – portfolio’s suffer significantly in the long-term.
For instance, a 50% drop in your portfolio needs a 100% gain just to get back to breakeven. . .
You can see how large market crashes every few years can really hurt retirement accounts.
Spitznagel’s wisdom is worth listening to in today’s over-valued, frothy, and complacent markets.
So, should investors be wary of Buffet’s ‘keep buying stocks’ talk? Going forward, what is the prudent strategy?
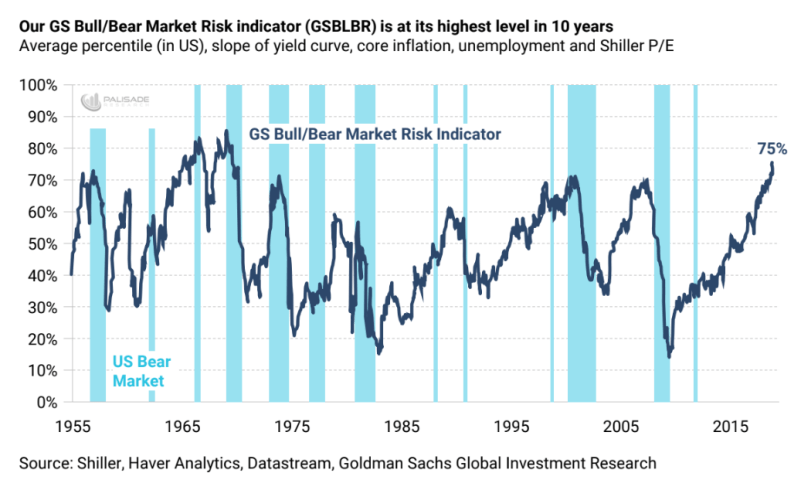
Well, according to Goldman Sachs (NYSE:GS) – a bear market is nearing very soon.

Historically, this indicator’s done an excellent job signaling the beginning of a bear market (although not perfectly).
And at 75%, the indicator’s at levels that has always preceded a bear market. . .
So, while this doesn’t indicate that a bear market is guaranteed tomorrow – it is worth taking into consideration.
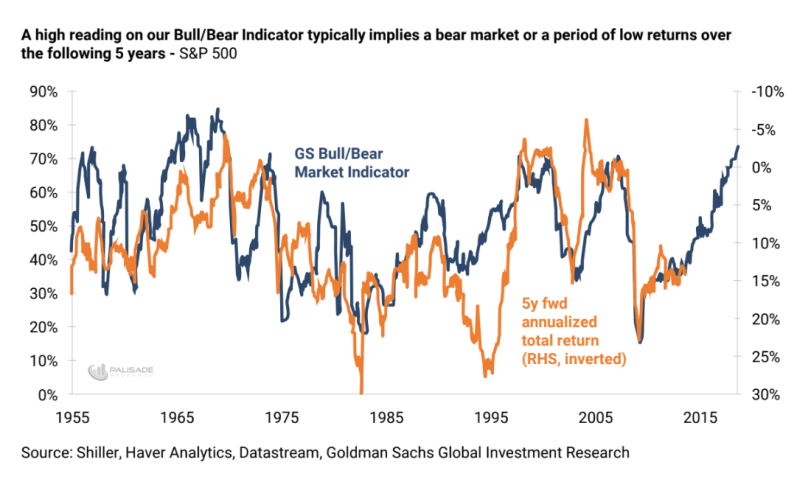
Now the big question for investors is: what’s the most likely scenario for stock prices over the next five years? Higher or lower?
There’s consistent historical data showing that a high-level on the Goldman Sachs Market Risk Indicator implies five years of poor market returns.

While the Goldman Sach’s thesis is compelling – there’s also another important market metric that’s signaling huge downside ahead.
I’m talking about the Tobin Ratio – otherwise known as the ‘Q-Ratio’. . .
Created by Nobel Laureate James Tobin, the Q-Ratio is a method for investors to gauge the fair value of all firms relative to their combined market values.
This ratio is different than Buffet’s favorite metric (combined market caps-to-GDP). And it’s also one of Mark Spitznagel’s favorite ways to look at equity valuations. . .
The formula is to take the combined market cap value of all firms (how the markets valuing them) and divide it by the replacement costs of all its companies (how much it would cost to rebuild the business).
But a simpler method is. . .
Q-ratio = equity market value / equity book value
A one-to-one ratio means that market values and replacement costs are equal.
But if the ratio is between zero-to-one (0-1) then equities are cheap and are a “buy”. But if it’s over-one, stocks are expensive and should be avoided/sold.
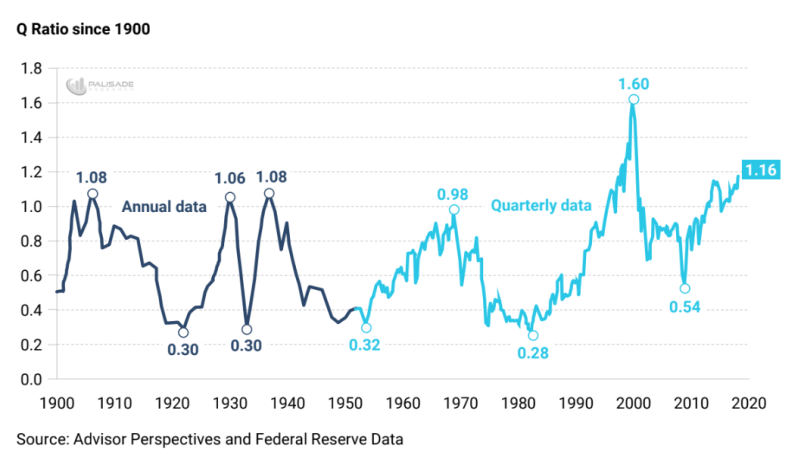
Since 1901, the Q-ratio has averaged .70 – therefore anything higher than .70 is considered overvalued, and anything below is considered undervalued.
So, what’s the Q-ratio at today, and how has it held up historically?

Currently, the ratio is at 1.16 – and it’s the second highest on record.
You can see that over the last 117 years, the Q-ratio has done a good job signaling when the market is cheap and when it’s expensive.
Unfortunately, the Q-ratio isn’t good for market timing. And it’s also not a short-term metric.
This is meant to show the markets longer-term outlook.
The takeaway from all this is that when the ratio is above .70, stocks are expensive. And there’s a greater risk for a market correction.
Or putting it another way: the higher it is above .70, the more negatively asymmetric (higher risk, lower reward) equities become (vice versa when below .70)
And even though the ratio’s at it’s second all-time highest, it doesn’t mean it can’t go higher.
All I’m saying is that each time it does go higher, there’s a greater risk for future downside. . .
It’s clear that contrary to Buffet’s words – equities are at very fragile levels.
All three – Buffet’s favorite metric, the Goldman Sachs’ Bull/Bear Risk Indicator, and the Tobin Ratio – are all signaling huge downside ahead for equities.
It may not happen tomorrow. It may not happen next week. But the risk of market prices declining are increasing daily.
Be cautious of what Buffet says – just like post-2008 when prices crashed, he’ll get billions in tax write offs. And a nice bailout.
None of us will get that luxury.
