Evident from the below chart of the S&P 500 Index and the Dow Jones Industrial Average, the start to 2016 has been a difficult one for investors. January saw a sharp decline in the equity markets; however, the month of February is working to repair the January damage. 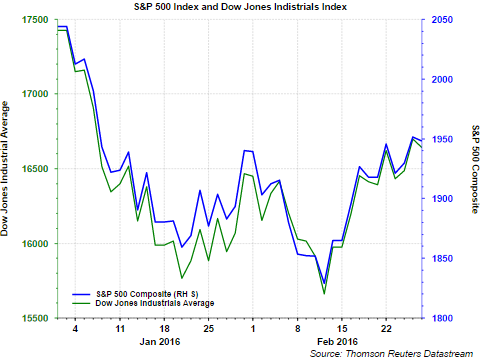
We noted in a post at the end of the third weak of January, Sentiment Supportive Of Further Equity Gains, that sentiment data seemed overly bearish and the market could recover. Certainly this has been the case, yet institutional and investor sentiment continues to tilt more bearish than bullish.
The chart below displays the NAAIM Exposure Index. The NAAIM Exposure Index consist of a weekly survey of NAAIM member firms who are active money managers and provide a number which represents their overall equity exposure at the market close on a specific day of the week, currently Wednesday. Responses are tallied and averaged to provide the average long (or short) position or all NAAIM managers, as a group. This week's data for the NAAIM Index continues to indicate active managers remain cautious on the equity market and is near levels notable for oversold markets. 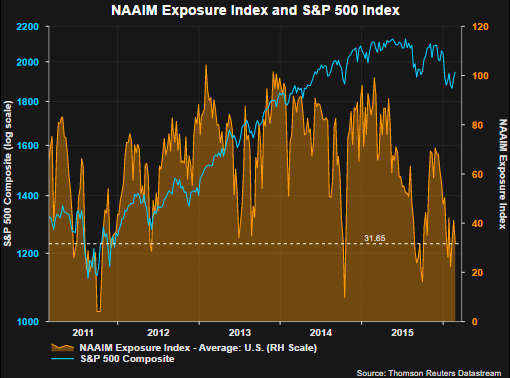
Additionally, although individual investors are slightly more bullish based on the Sentiment Survey from the American Association of Individual Investors, bullish sentiment remains at a low level. Last week's AAII report saw investor bullish sentiment increase to 31.19%, the first reading over thirty since the end of November last year.
In order to smooth out the week to week volatility in the sentiment reading, we look at the 8-period moving average. As the white line in the below sentiment chart shows, this average continues to track at an extreme level, even lower than that reached at the bottom of the financial crisis in March of 2009. 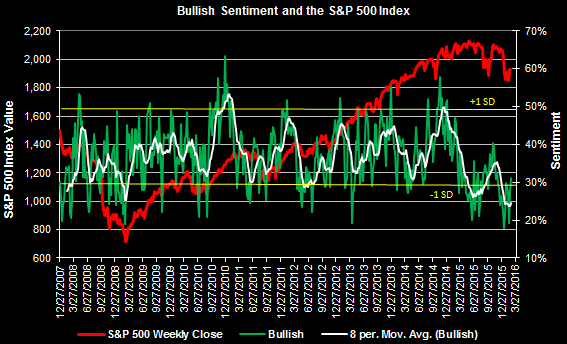
One data point needing to see improvement is that associated with the consumer and a reasonably strong spending and income report was delivered for January. It appears the benefit consumers receive through low energy prices is beginning to translate into increased spending. 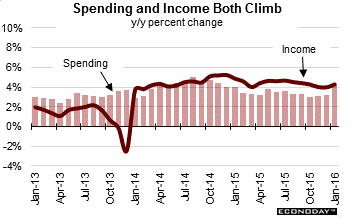
Econoday's commentary on the report:
"Personal income jumped 0.5 percent in January as did consumer spending, both readings higher than expected. Details are solidly positive with components on the income side led by wages & salaries, up a very strong 0.6 percent for the third large gain of the last four months. And year-on-year rates are climbing again with total income up 4.3 percent and with wages & salaries at 4.5 percent, which are far from torrid but the direction is definitely favorable. And consumers didn't draw from savings on their January shopping spree, with the savings rate unchanged at a very solid 5.2 percent. Components on the spending side are led by durable goods which jumped 1.2 percent and reflect strong vehicle sales in the month. Spending on services rose a monthly 0.6 percent. Year-on-year, spending is up 4.2 percent. Again, this isn't great but it does point to a surprisingly strong start to the first quarter which looks to double or triple the fourth-quarter's annualized growth rate of 1.0 percent."
And finally, the improvement in equity returns in February is occurring in some of the more economically sensitive sectors. The below chart shows materials are up 8.5% this month and industrials are higher by 4.9%. At a minimum the market may be beginning to factor in the easier earnings comparisons firms will face as they lap the headwinds from the strong US dollar and the contraction in energy prices. 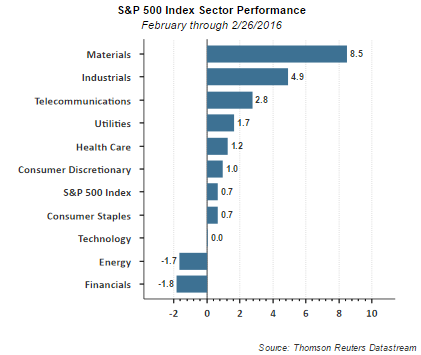
One thing we know about the market is it does not move higher in a straight line. The strong recovery over the last two weeks may see some consolidation of these recent gains.
However, some glimmer of hope is beginning to surface in a number of economic reports, a revised higher GDP number, an improvement in industrial production and improvement seen in the durable goods report. Everything is not roses as weakness was seen in Markit's Manufacturing PMI and the ISM Manufacturing Index. Investors continue to deal with mixed economic reports, but a number of the reports are beginning to turn positive. If one believes stock prices follow earnings, improvement in earnings reports would be a welcomed outcome.
