Two Fridays ago (1/15/2016) I highlighted sentiment readings often associated with an oversold equity market. Two days later, Wednesday of this past week, the S&P 500 index bottomed and staged a turnaround, generating its first weekly gain of the year, up 1.4%. A number of the sentiment measures improved with this turnaround, yet two positive return days does not qualify as a new bull market. Below is a table consisting of a number of sentiment indicators comparing readings from two weeks ago to the just concluded week.
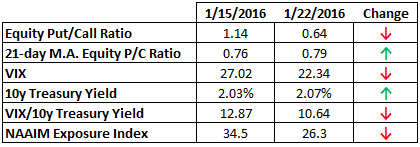
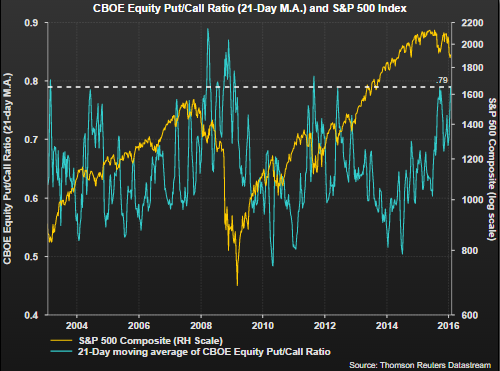
The equity put/call ratio, the VIX and the VIX/10-year Treasury Yield ratio improved. Although improvement was seen in the P/C ratio, the 21-day moving average of the ratio moved higher to .79 versus last week's average level of .76 as can be seen in the below chart. A sustained move lower in this average is associated with increasing equity prices. With the elevated level of this average, a turn lower is a high probability.
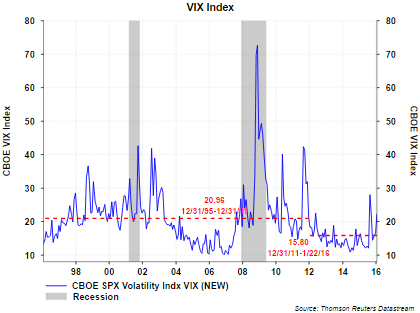
One recent concern for investors is the spike in volatility experienced by the market. A part of the heightened awareness has been the lack of downside volatility from 2011 until the August 2015 correction. Since 2011 the VIX index has traded at a lower average level of 15.80 compared to the time period from 1995-2011 when the average was 20.96. As noted in several earlier blog posts, the VIX index is a measure of implied equity volatility. Higher levels in the VIX imply a higher level of market uncertainty or fear.
In an effort to compare the VIX to economic expectations, one can evaluate the VIX divided by the 10-year Treasury Yield. A number of factors can influence Treasury yields, but the perception is lower yields on longer term Treasuries are reflective of a weaker economic environment. As a result, one would want to see a lower VIX-to-10-year ratio. As the table above noted, this ratio has declined over the last week.
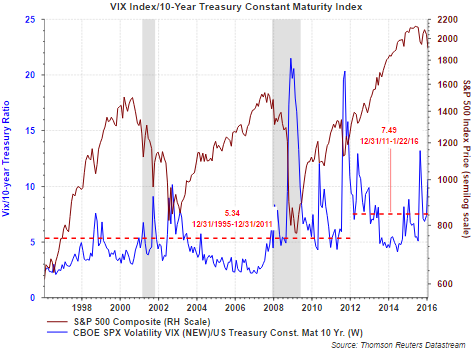
Of importance is the fact this ratio has traded at a higher average level since 2011 at 7.49 versus 5.34 from 1995-2011. As can be seen in the VIX only chart above, the VIX has traded at a lower level since 2011. Consequently, the VIX/10 year ratio has been higher due to the lower level of the 10-year Treasury, indicating the market has been expecting a weaker economic environment. And the economy has been growing below its long term potential.
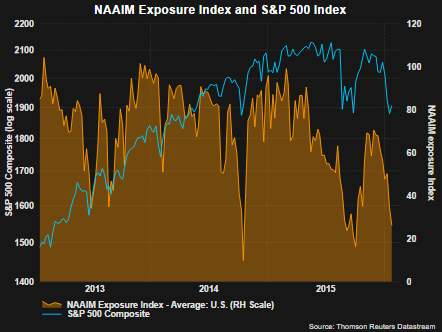
Lastly, the NAAIM Exposure Index is trading at a level notable for oversold markets. The NAAIM Exposure Index consist of a weekly survey of NAAIM member firms who are active money managers and provide a number that represents their overall equity exposure at the market close on a specific day of the week, currently Wednesdays. Responses are tallied and averaged to provide the average long (or short) position or all NAAIM managers, as a group.
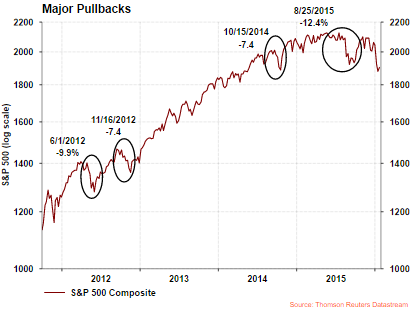
This lower equity volatility translated into the market moving higher nearly unabated since 2011. August 2015 rolls around and breaks the nearly four year streak without a greater than 10% correction as the market fell 12.4%. A market recovery took hold into year end and another correction unfolded this month.
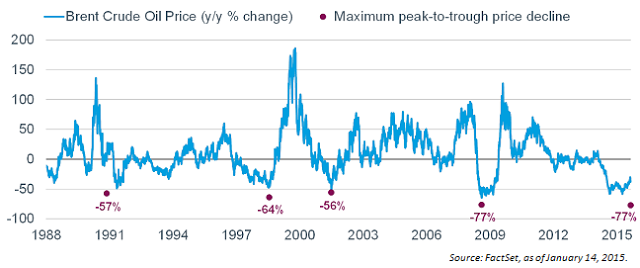
For a number of reasons I expect the equity market to experience higher volatility going forward. The core of the Federal Reserve's quantitative easing programs has ended and the Fed has embarked on a tightening program with December's rate increase, and this is likely to cause increased market volatility, but not all to the downside. The issues impacting the energy market are also negatively weighing on the market and investor sentiment. A difference between 2008/2009 and now is the fact the 08/09 issues were related to housing and ultimately negatively impacted the consumer. With the issues facing the energy sector, the outcome has been lower oil prices and this serves as a broad benefit for consumers. As Charles Schwab (N:SCHW) recently noted in a report, it would also be the first time a sharp decline in oil prices led to a recession.
The coming week will contain potentially market-moving news. The Fed has a meeting scheduled with an announcement on Wednesday, the first estimate of fourth quarter GDP is reported on Friday and 44 companies report earnings this week. A number of energy, materials and industrial firms are included in the 44 announcements and the market will look to guidance for insight into potential economic growth ahead.
