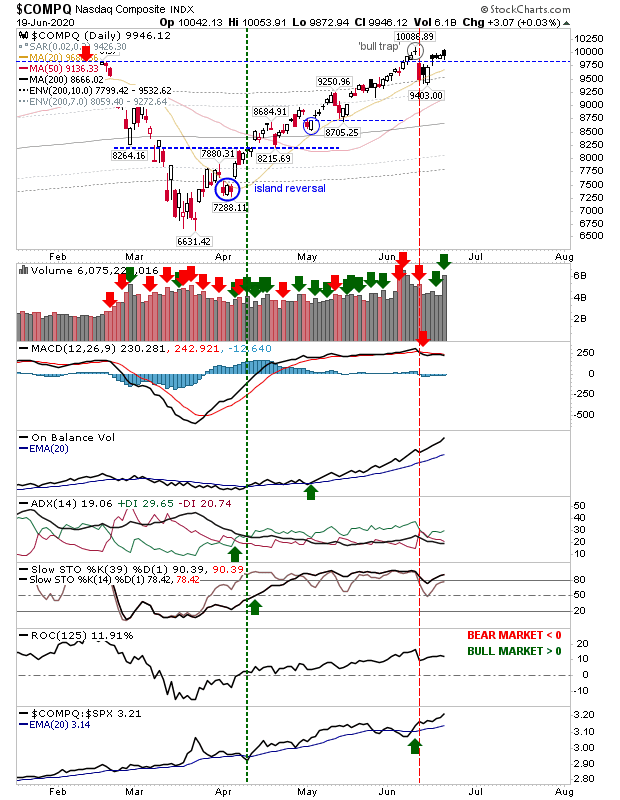
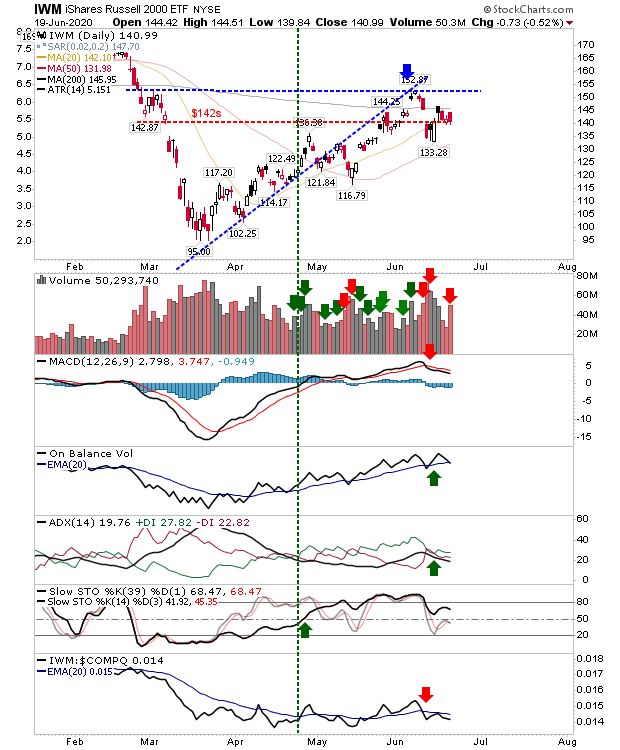
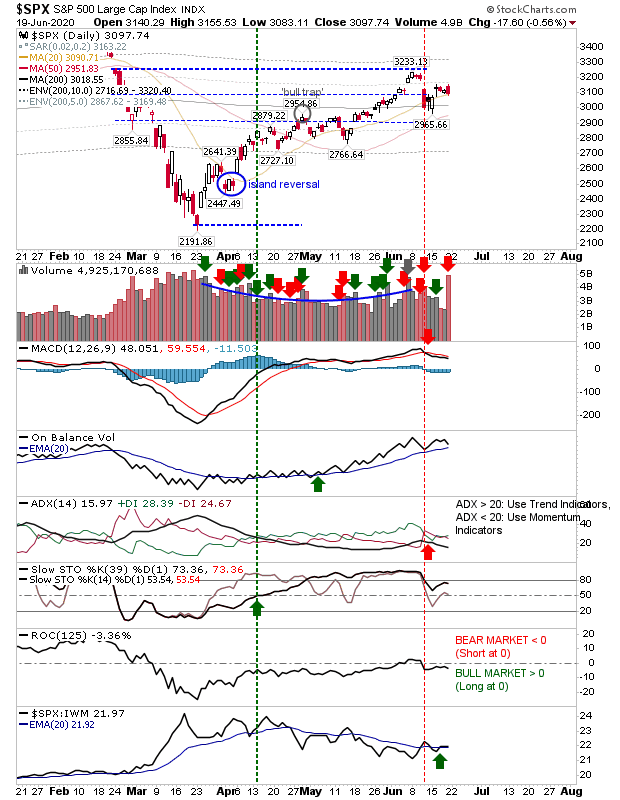
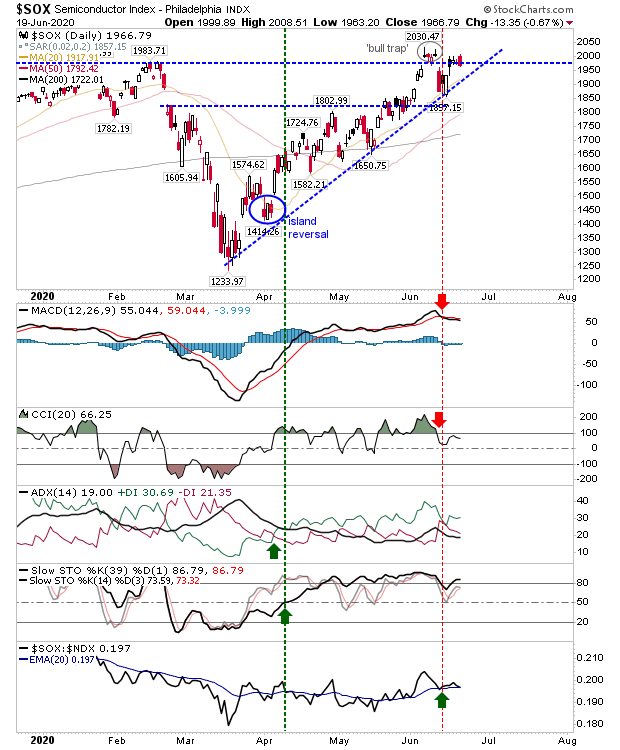
Bulls weren't able to close out the week on a high as Friday's candlestick was a mix of a bearish engulfing pattern or black candlestick (lower close to open, but close above prior day's close). In the case of the NASDAQ, the gap closed but the 'bull trap' remains unchallenged.
The NASDAQ closed with a 'bearish' black candlestick on higher volume. The MACD trigger 'sell' remains but other technicals are positive.

The Russell 2000 (via iShares Russell 2000 ETF (NYSE:IWM)) finished with a bearish engulfing pattern on higher volume distribution. Despite the early break through the 200-day MA it has since struggled to get itself back beyond the moving average.

The S&P also finished with a bearish engulfing pattern on higher volume distribution. The MACD is still on a 'sell' trigger but other technicals are okay and the index has a small relative advantage against the Russell 2000.

The Semiconductor Index also finished with a bearish engulfing pattern right on breakout support. The 'bull trap' is still in play, but there is also a 'sell' trigger in the MACD and CCI.

Bulls still haven't been able to break through the 'bull traps' in the NASDAQ or Semiconductor Index. There is a general lack of willingness on the part of market participants to make a sustainable push to new highs; the COVID-19 recovery was easy, but making new highs has proven to be another challenge entirely. This may be the start of a new trading range, perhaps anchored by the March low.
