With no clear direction from any of the Asian influences, it isn’t surprising to see more listlessness in everything from stocks to bonds. The Dow was up, the NASDAQ down, and the S&P 500 somewhere in between.
The 10-year UST that had looked primed for receding back into the 1.60s (for yield) bounced back to around 1.55% and has been steady at that level almost all day. Most importantly, JPY was equally undecided, trading higher in the Asian session overnight, then lower heading into the US open before moving back up again for the rest of the session.
It may be that “markets” are somewhat confused about what comes next; since JPY was the sentimental spring of hope in “helicopter money” effect, its distinct lack of conviction extending into a third day would be perplexing to expectations that might have been set early last week.
I didn’t think there was much to it in terms of volume and depth, but even the sentiment here seems rather more uninspiring compared to the burst of particularly confident commentary about it all at the beginning. This should not have been surprising, however, because this is exactly what happened in January.
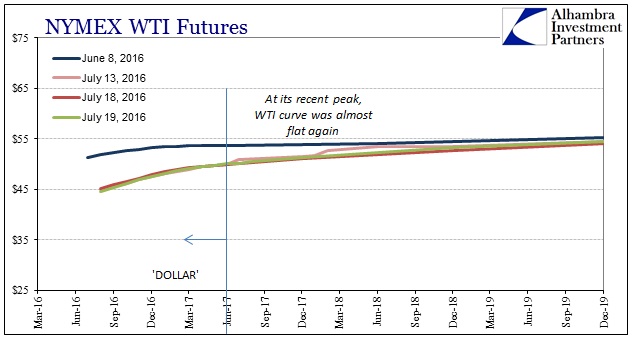
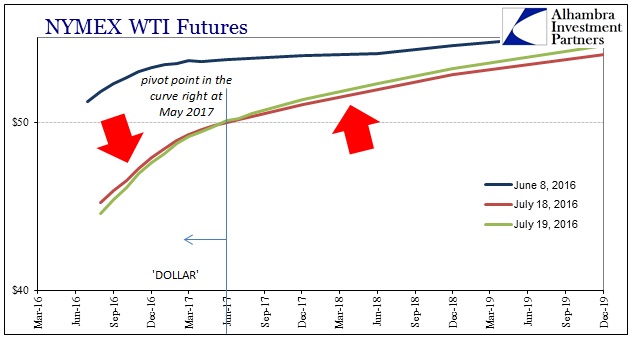
Maybe the Bank of Japan and the rumors will get it sorted out in their favor, but for now uncertainty has crept back in and that seems to suggest a more baseline approach. Oil prices, for example, were down today, but they were also up, too. In other words, the front end of the curve was lower while the back end was higher; a steepening contango is the unmistakable context of the “dollar.”
As if we needed any more evidence, the pivot point in the futures curve was the May 2017 contract, almost exactly where we have consistently noted the boundary of heavier “dollar” influence before.


The May contract ended trading down $0.09 from yesterday’s settled price, while the June contract finished up a penny. The front month, August 2016, was down the most at -$0.67, while the outer years were higher by $0.30 to $0.50. There isn’t a whole lot of volume out that far on the curve, but still more than $1 in additional contango today, even out to June 2018, can make a difference in physical conditions.
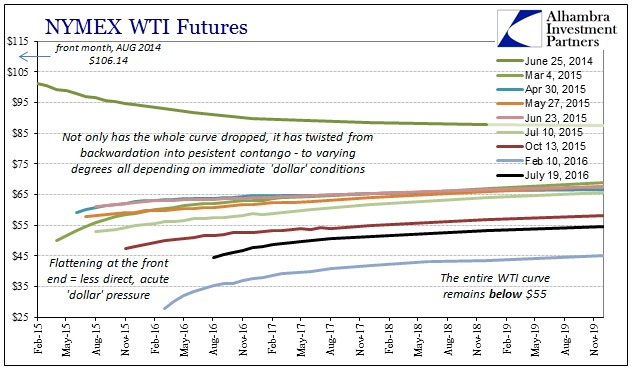
The oil futures curve “wants” to go back to backwardation, a condition it hasn’t been close to in more than two years now. Steepening contango, especially at the front end, is an important distortion that by its contrary setup leaves us with the only “dollar” influence and the negativity (physical and financial) that always follows.

The significance of finding the “rising dollar” on a day like today is inferring that the (those) baseline tendency(ies), where it (they) seem(s) to have conviction, might be lacking. That might be the reason as to why the whole curve isn’t lower, but not enough to prevent distinct funding “tightness” from taking its once more usual station.
In other words, there was no conviction in anything today except WTI contango. In the end, that might not amount to much, just one day after all, but this pattern continues to repeat on all sorts of days.
