Equities and risk-linked currencies continued sliding on Monday, while demand for safe havens stayed elevated. Apparently, investors remained fearful over the spreading of the coronavirus, which could well impact economic activity. As for tonight, during the Asian morning, apart from headlines surrounding the virus, AUD-traders may also pay attention to Australia’s CPIs for Q4, as they try to figure out when the RBA may deliver another quarter-point decrease in interest rates.
Risk Assets Keep Tumbling, Safe Havens Gain on Virus Spread
The dollar traded higher or unchanged against the other G10 currencies on Monday and during the Asian morning Tuesday. It gained against NOK, AUD, NZD, SEK, CAD and fractionally against EUR, while it was found virtually unchanged against GBP, CHF and JPY.
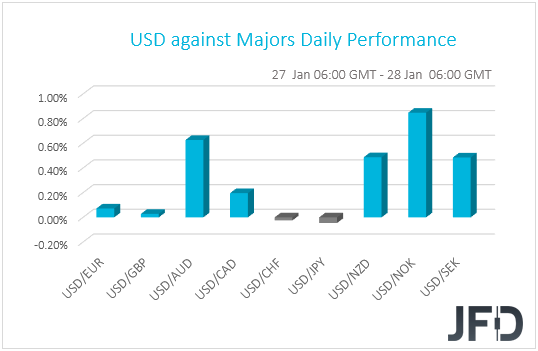
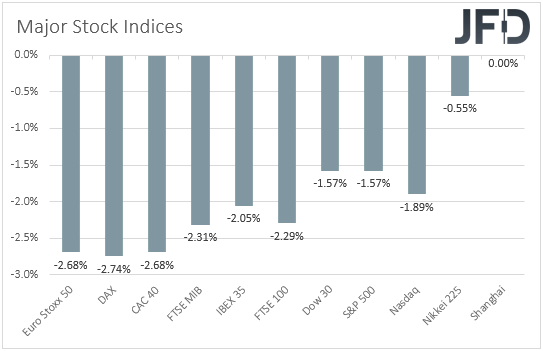
The relative strength of the safe havens CHF and JPY and the weakening of the commodity-linked AUD and NZD suggests that investors returned to their desks in a risk-averse mood this week. Indeed, major EU and US indices were a sea of red, with all the EU ones tumbling more than 2.0%, and the US ones posting losses of more than 1.5%. The negative sentiment rolled into the Asian trading as well, with Japan’s Nikkei sliding 0.55%.
Once again, it was all about the coronavirus, the outbreak of which started in China and is now spreading around the globe. Over the weekend, China’s National Health Commission rang alarm bells announcing that the virus’s transmission ability is getting stronger, while overnight, they reported that the death toll has climbed to 106, and that the number of confirmed cases in China has surged to 4515. The virus has also spread to more than 10 countries, including France, Japan and the US, though no deaths were reported outside of China yet. The US has confirmed five cases, France three, and Canada two, although more potential cases are investigated.
Investors remained fearful over further spreading and concerned with regards to the virus’s impact on economic activity. Travel bans over the Lunar New Year holiday period, which China extended in order to keep people at home, combined with any impact on growth, raised worries over dampening demand for crude oil as well, with both Brent and WTI staying in a free fall mode. Gold wore its safe-haven suit and opened with a gap above Friday’s peak of around 1576, to rest above that zone for the rest of the day.
As for our view, it has not changed. As long as news and headlines keep feeding fears over a wider spread, investors are likely to keep reducing their risk exposures and seek shelter in safe haven. That said, given the overstretched market moves we saw the last few days, we cannot rule out minor corrections before equities and other risk-linked assets take the down road again, and defensive assets attract more flows.
Euro Stoxx 50 – Technical Outlook
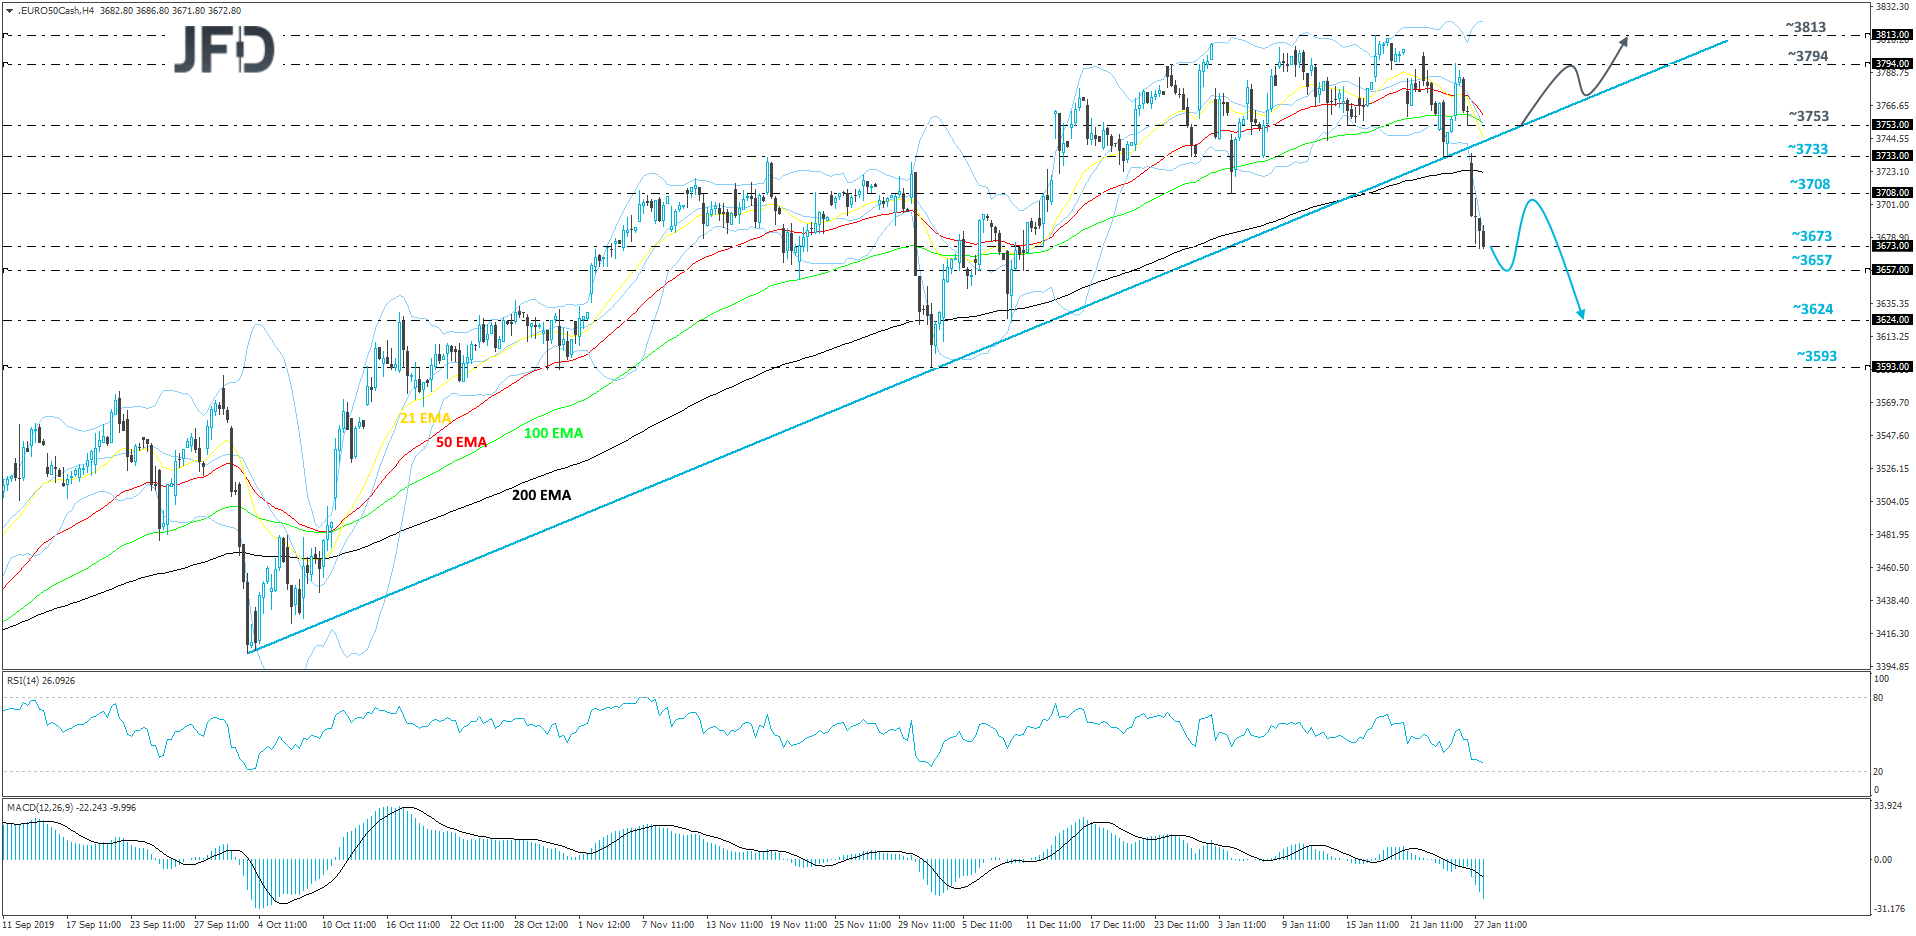
Yesterday, the Euro Stoxx 50 index broke its medium-term upside support line drawn from the low of October 2nd. In addition to that, the price slid below its 200 EMA on the 4-hour chart. All this leads to a potential continuation move lower, especially if the index stays below that upside support line. That’s why we will stay bearish for now with regards to the short-term picture.
If Euro Stoxx 50 continues to slide a bit lower, it may end up testing the 3657 hurdle, which is the low of December 11th. Initially, the area might provide some support, from where the price could bounce a bit, potentially pushing the index for some correction. That said, if the price struggles to get back above the 200 EMA, this might result in another round of selling, which could bring Euro Stoxx 50 to the 3657 obstacle again, a break of which may send the index to the 3624 level, marked by the low of December 10th.
Alternatively, for us to examine the upside again, we would wait for a push back above the aforementioned upside line first. At the same time, the price would be placed above the 3753 barrier, which marks the low of January 24th. More buyers may see this as a good opportunity to step in and take the lead. Such actions could result in a move to the 3794 hurdle, a break of which may send the index to the 3813 level, marked by the highest point of January.
AUD-Traders Await Australia’s Inflation Data
As a risk-linked currency, the Aussie is likely to continue being driven by developments surrounding the broader investor morale. However, AUD-traders may shift attention for a while to Australia’s CPIs for Q4, which are due to be released tonight, during the Asian morning Wednesday. The headline rate is forecast to have remained unchanged at +1.7% yoy, while the trimmed mean one is anticipated to have ticked down to +1.5% yoy from +1.6% in Q3.
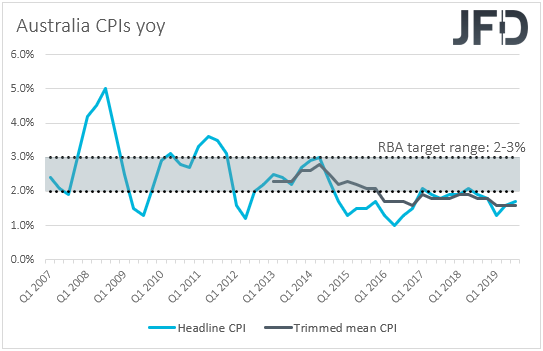
At its latest meeting, the Bank kept interest rates unchanged at 0.75%, but the statement accompanying the decision may have been less dovish than many may have expected. Officials said that they decided to hold rates steady given the long and variable lags in the transmission of monetary policy. Although they reiterated that they will continue to monitor developments, including in the labor market, and ease policy further if needed, the aforementioned addition suggests that they were more comfortable on the sidelines.
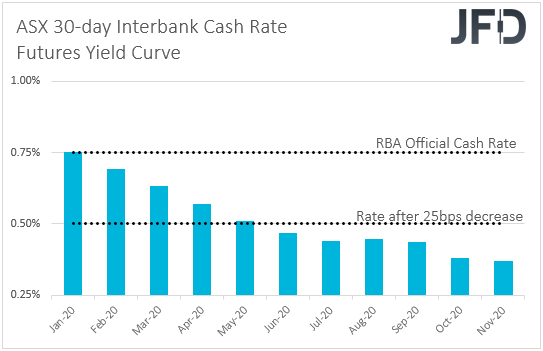
However, following the devastating bushfires, investors raised bets that the fires’ effects on the economy could force the RBA to hit the cut button as soon as at its upcoming gathering. That said, the better-than-expected employment numbers for December prompted participants to push back those bets and, according to the ASX 30-day interbank cash rate implied yield curve, they are now fully pricing in a quarter-point rate reduction to be delivered in May. Despite the potential slowdown in the trimmed mean CPI rate, still, both rates will be in line with the RBA’s latest projections and thus, we don’t expect them to drastically alter cut expectations. For investors to bring that timing closer again, a larger than expected slowdown could be needed. Something like that, combined with headlines over further spreading of the Chinese virus may push the Australian currency off the cliff.
AUD/CHF – Technical Outlook
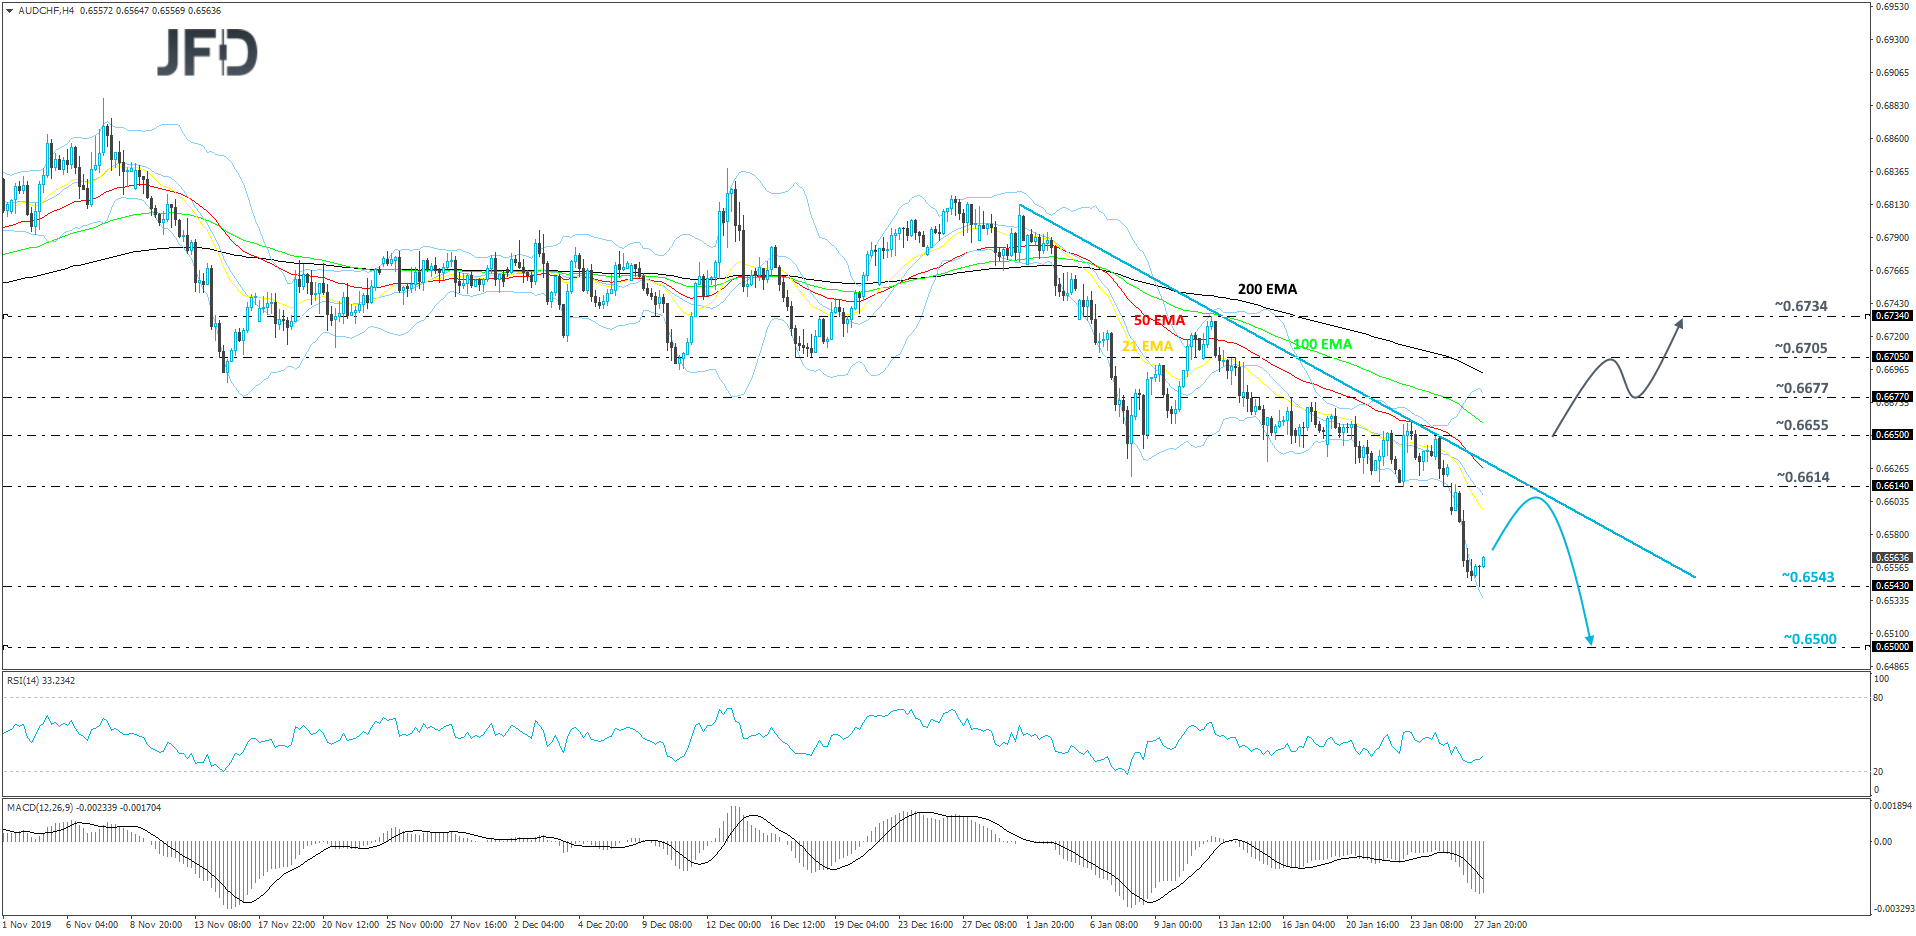
AUD/CHF continues to drift lower, while running below a short-term downside resistance line drawn from the high of December 31st. Given the steep fall yesterday, we may see a small correction back up again, but as long as the rate stays below that downside line, we will stay bearish.
This morning, we can see that the bulls found refuge near the 0.6543 hurdle, which acted as a good support. Now, AUD/CHF is showing willingness to push a bit to the upside again. But as we mentioned above, as long as that line keeps the rate below it, there is a good chance the pair could slide again. If this time the 0.6543 area fails to withstand the bear pressure and breaks, this would confirm a forthcoming lower low and AUD/CHF could make its way to the 0.6500 level, marked near the lowest point of August 2019.
In order to shift our short-term view to the upside, a break of the previously-mentioned downside line would be needed. In addition to that, a strong push above the 0.6650 barrier, which is the high of January 24th, could attract more bulls into the field again. If so, we will then aim for the 0.6677 hurdle, a break of which may send the rate to the 0.6705 zone, which is the high of January 14th. The pair might stall there for a bit or correct to the downside. That said, if the bears are still feeling weak, the bulls may take advantage of the lower rate and push higher. If so, AUD/CHF could re-test the 0.6705 obstacle, a break of which might send it to the 0.6734 level, marked by the high of January 13th.
As for the Rest of Today’s Events
From the US, we get durable goods orders for December, as well as the CB consumer confidence index for January. Both headline and core orders are expected to have rebounded 0.5% and 0.2%, after sliding 2.1% and 0.1% respectively. The CB index is anticipated to have risen to 128.0 from 126.5.
With regards to the energy market, we get the API (American Petroleum Institute) weekly report on crude oil inventories, but as it is always the case, no forecast is currently available.
Overnight, apart from the Australian CPIs, we also get the BoJ’s summary of opinions from its latest meeting. The statement of the gathering had a cautiously optimistic flavor, enhancing our long-standing view that there is no urgency for policymakers to hit the cut button. Thus, we will scan the summary to see whether this is indeed the case.
We also have one speaker on today’s agenda: New York Fed President John Williams.
