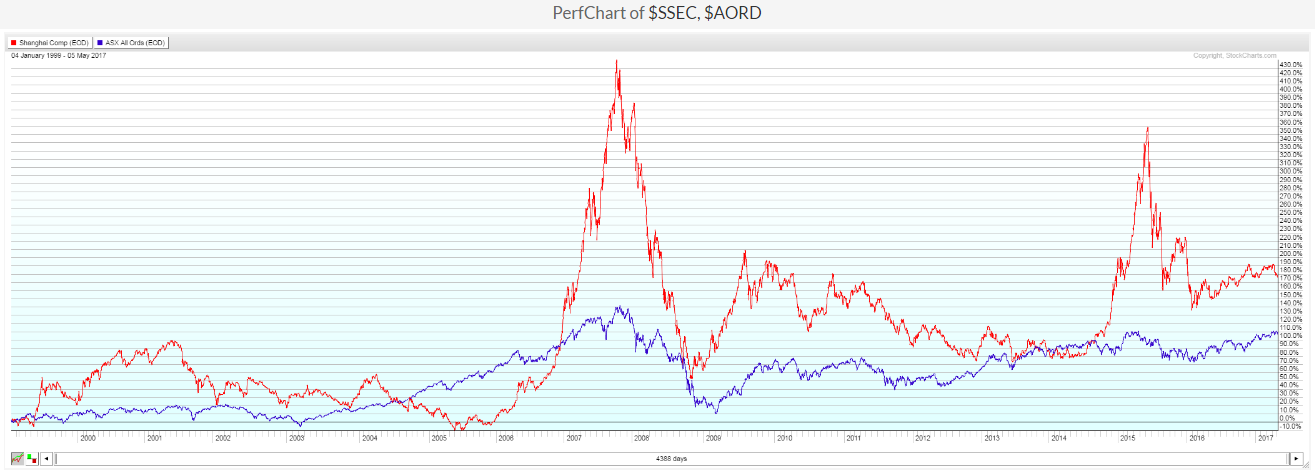
For many years, the charts have shown that, as China's Shanghai Index (SSEC) goes, so goes Australia's Composite Index (AORD), as shown on the multi-year comparison graph below.
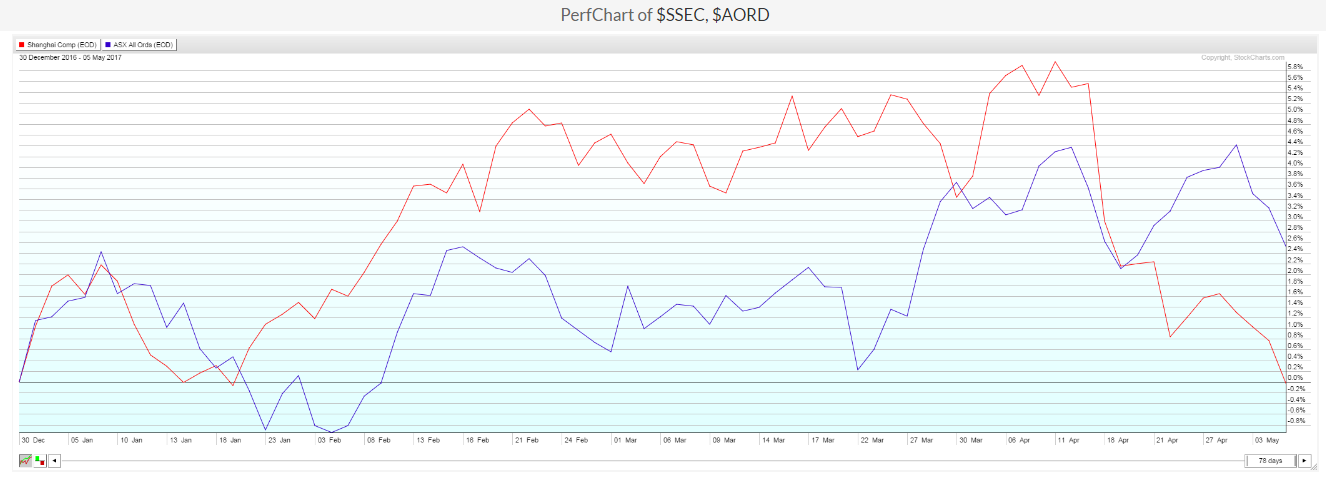
However, a closer look at the following year-to-date comparison graph reveals that SSEC's attempts to continue to advance fizzled in mid-April; it's now flat for the year, while AORD remains a bit more elevated.
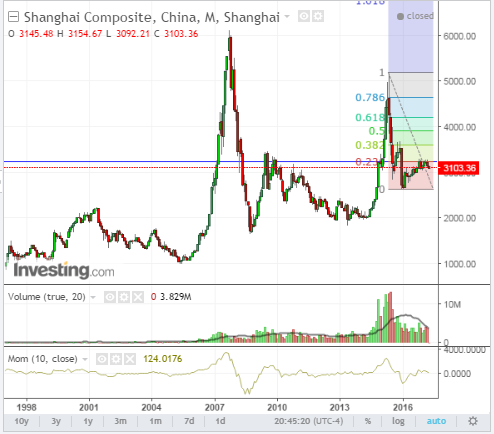
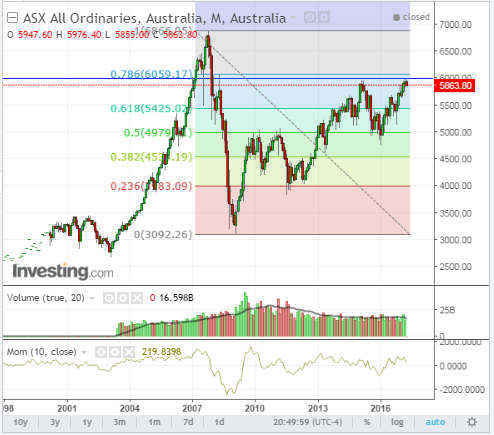
A look at the following Monthly chart of SSEC shows that price remains below significant major price with Fibonacci resistance at 3250, while AORD is also facing major price and Fibonacci resistance from 6000 to 6050, as shown on the next Monthly chart.
A look at the following year-to-date comparison graph shows that the Aussie dollar has been steadily declining since March 21...perhaps forecasting weakness that eventually followed in SSEC and a halt to further advancement of AORD.
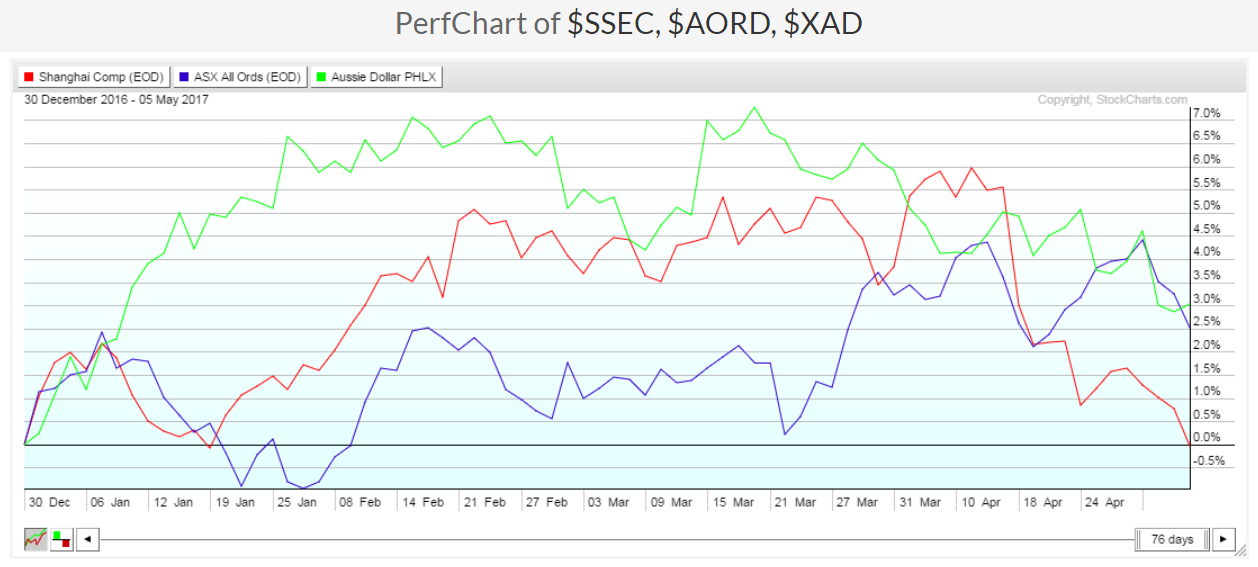
As I mentioned in my post at the end of March, we'll see if continued weakness in SSEC, AORD, and the Aussie dollar have any negative influence on the MSCI World Index, or U.S. equities.
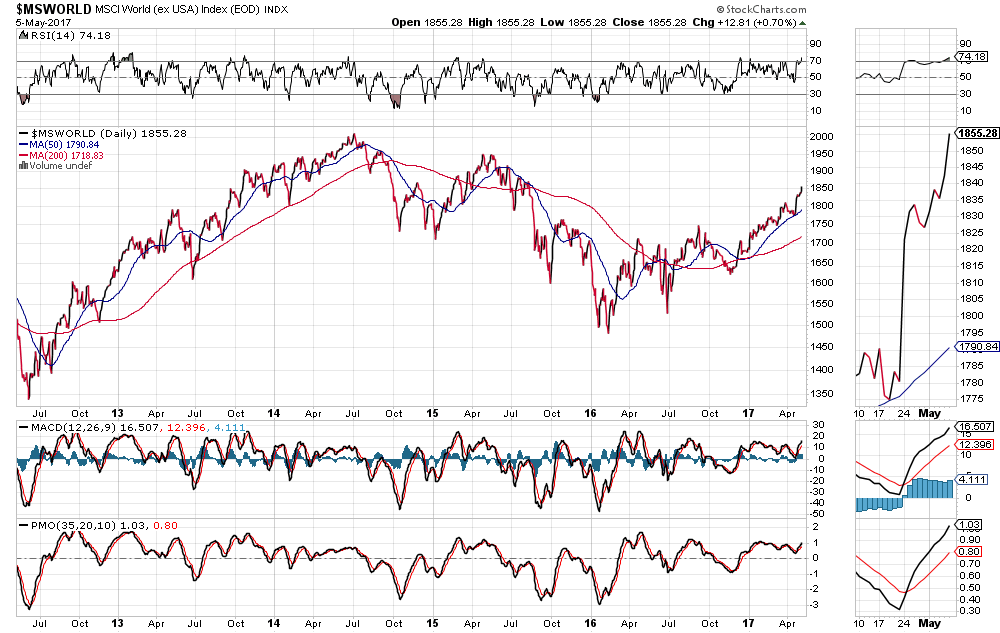
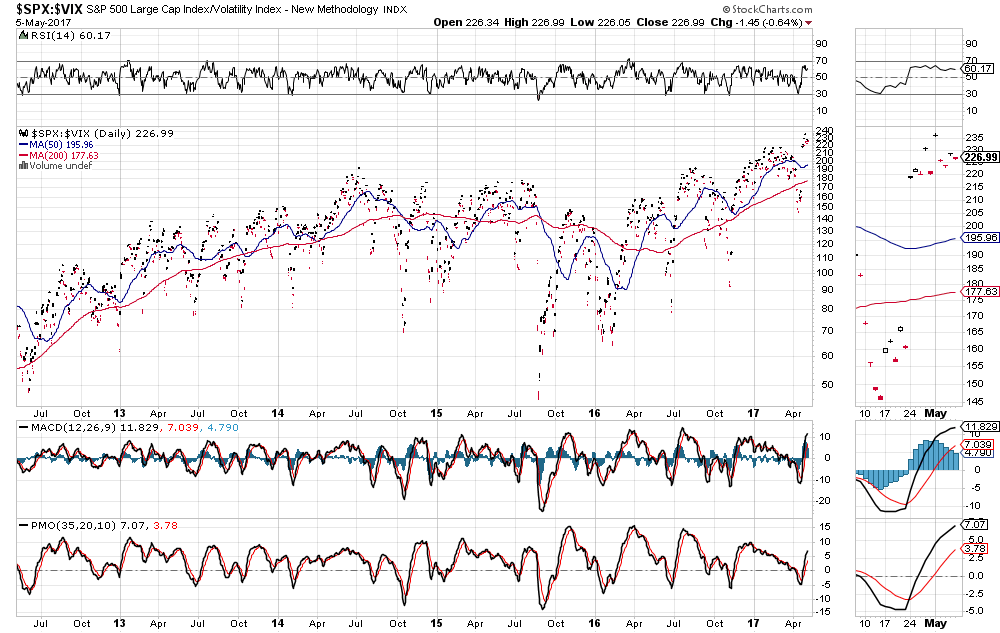
So far, the World Market Index remains unaffected, as it has reached a new high for the year, as shown on the following Daily chart, while the SPX:VIX ratio hovers just below its new all-time high (set on May 1), as shown on the Daily ratio chart below.
It may take something rather significant to induce any kind of major selling of Chinese and Australian assets and currency, and before it has any major impact on the the U.S. and world market, as a whole.
However, these are charts worth monitoring for the coming days and weeks, inasmuch as they have tremendous overhead resistance to overcome and will need fresh incentive/stimulus to achieve any meaningful and sustainable breakthrough.

