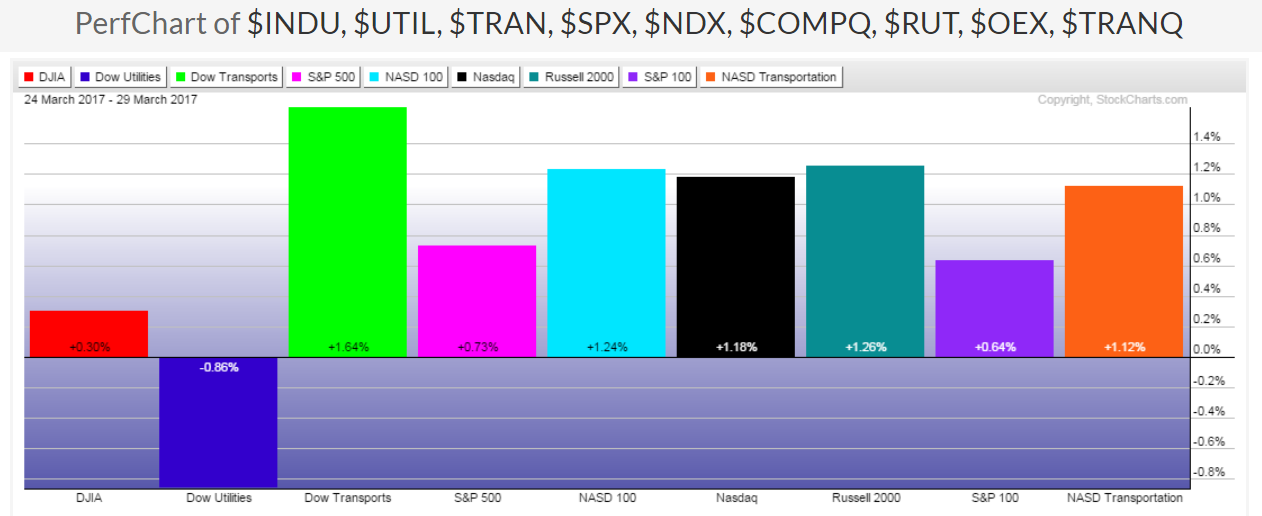
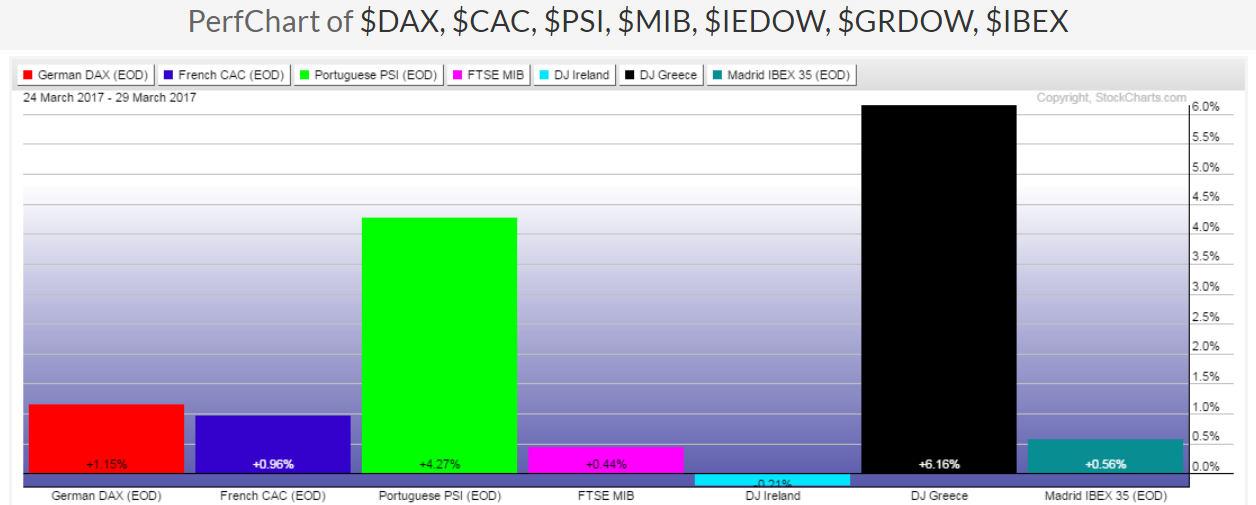
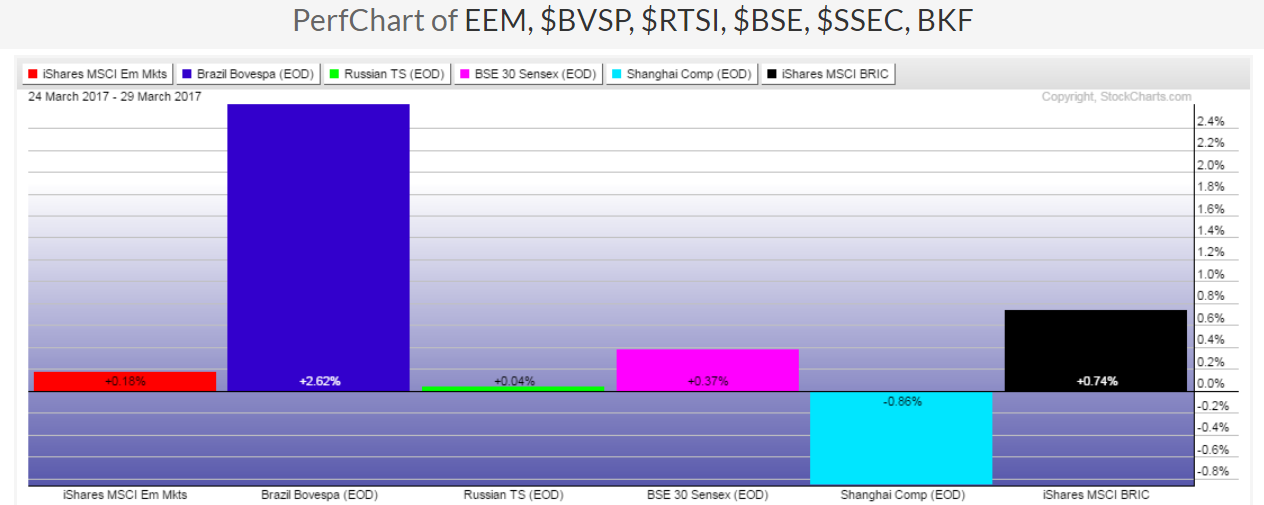
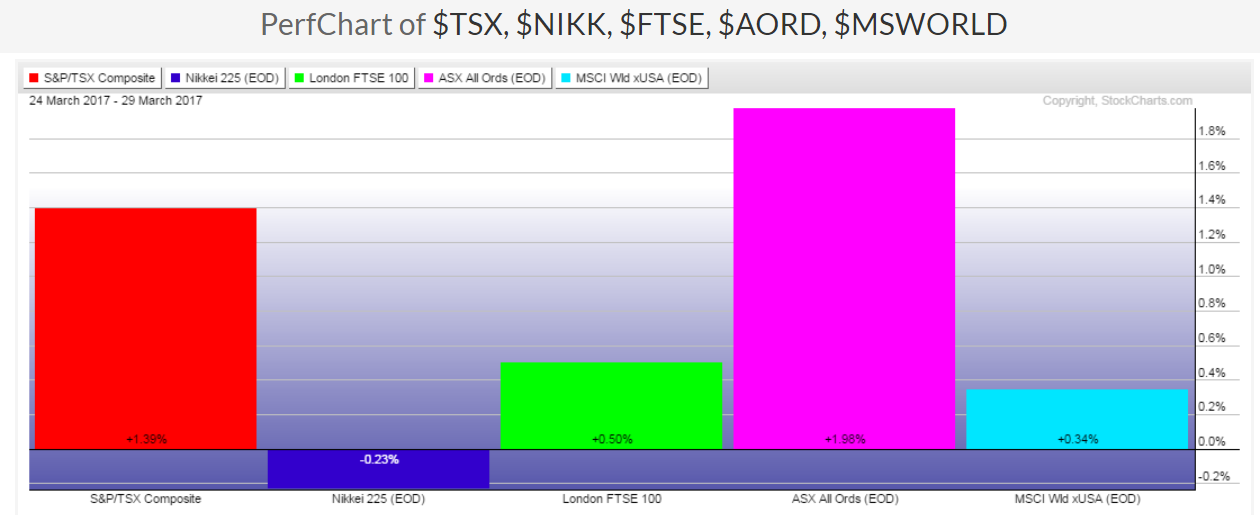
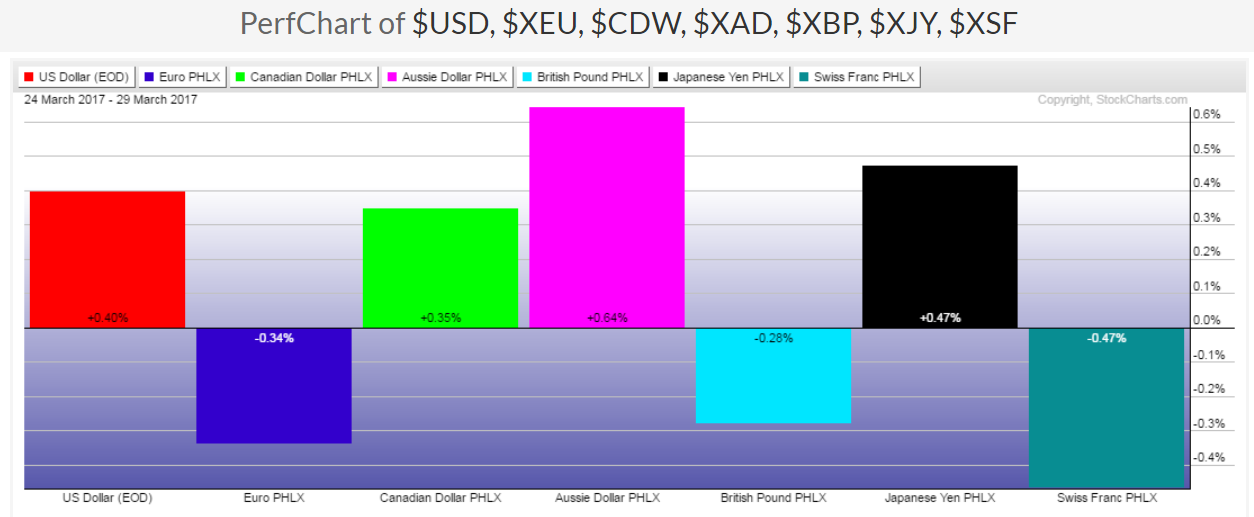
The following five percentages gained/lost graphs show, at a glance, which countries and currencies gained the most, so far, this week (Monday, March 27 to, and including, Wednesday, March 29).
Of particular interest to me are the gains made in Australia and in the Aussie dollar.
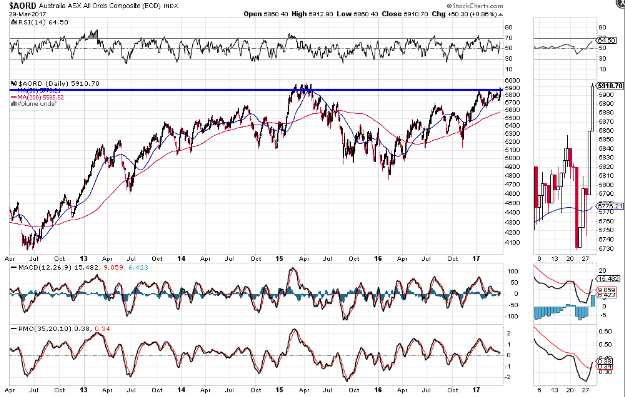
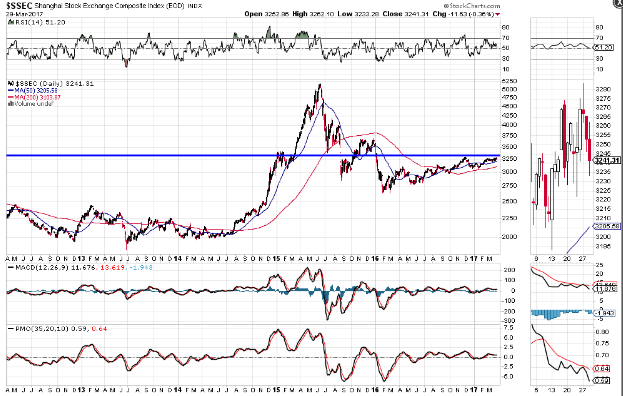
As noted on the following daily chart of the Australian Index, price has shot up in the past few days and is, once again, facing major resistance. It's worth keeping an eye on this index, as a firm breakout and hold above its 2015 highs could also accompany a rally in the Shanghai Index. Price on that index is also facing major resistance, as shown on the second daily chart.
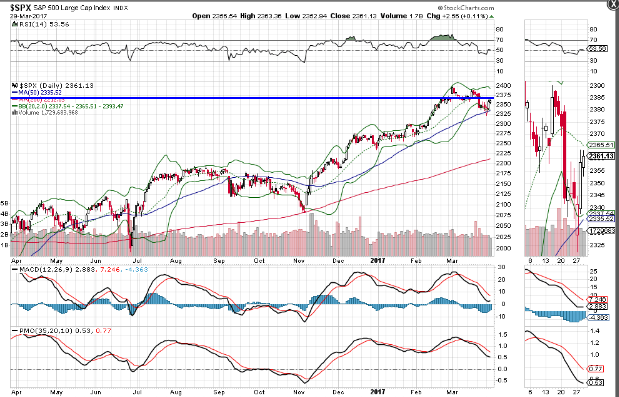
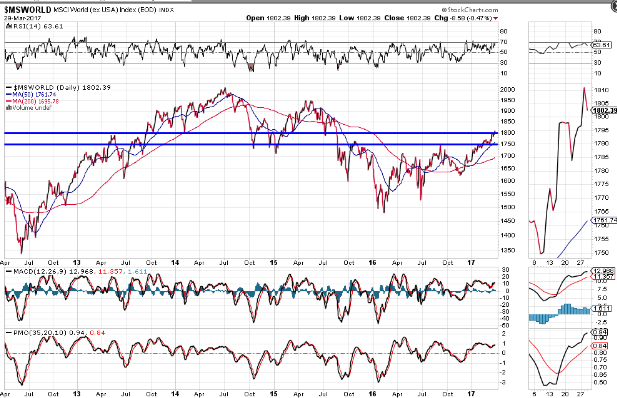
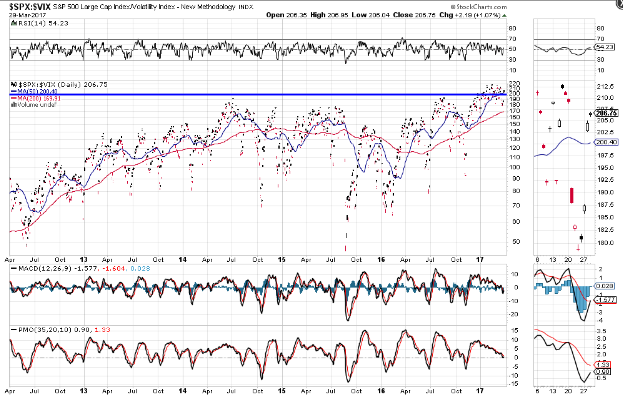
My post of March 10 and update of March 19, spoke of an interdependent relationship of the SPX with the World Market Index and the SPX:VIX Ratio.
All three of these are grappling with major resistance levels, as shown on the following daily charts.
CONCLUSIONS:
We'll see if Australia, China, the SPX, the World Market Index, and the SPX:VIX Ratio reach new highs, either by the end of this week (to close out Q1 for 2017 with higher gains), or anytime soon in April, and whether any short-term weakness or strength in any one of them influences the others, in kind.

