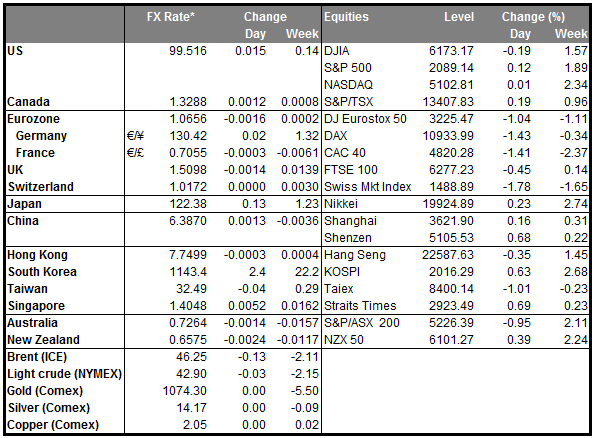
• Asian equity markets mostly in the green Asian equity markets rallied today, with the only exception being China’s Shanghai Composite 300, which closed somewhat below its opening mark after a week off. Japan’s Nikkei 225 jumped by more than 7%, but given that overnight data showed that the Japanese economy contracted by more than expected in Q4, we see the possibility that the bounce could be short-lived. The jump may have come as a result of PM Shinzo Abe’s comments that excessive volatility in FX is undesirable and that Tokyo ‘would intervene where necessary’ to influence such moves. The stock market rise curbed the demand for safe-haven assets, such as the yen, the euro and gold. We believe that the positive sentiment is likely to carry over into the EU markets, which could recover some of their recent losses. Nevertheless, with no evidence that concerns over the global economy have dissipated, we will treat the recovery with caution.
• China’s exports and imports continue to fall China’s exports and imports continued to disappoint as they fell by much more than expected in January. The trade surplus increased, but only because imports fell faster than exports. This suggests that the depreciation of the yuan has done very little to boost the competitiveness of Chinese exports since August. In an interview over the weekend, the PBoC Governor said that there is no basis for continued yuan depreciation. Indeed the yuan’s fixing today was sharply higher than usual, which makes us believe that the PBoC may need to act again in an attempt to revive the Chinese economy, perhaps in the form of additional rate cuts or reductions in banks’ reserve requirements.
• Today’s highlights: During the European day, we get the trade balances from Eurozone and Norway, but no forecast is available for either.
• Markets will remain closed in the US and Canada due to public holidays.
• We have only one speaker on Monday’s agenda: ECB President Mario Draghi will speak before the European parliament.
• As for the rest of the week, on Tuesday, during the Asian morning, the RBA releases the minutes of its February meeting. At this meeting, the Bank remained on hold but signaled a strong easing bias, which would depend on incoming data. The Bank also acknowledged the global turmoil and the risks that poses to domestic conditions. RBA Governor Stevens said on Friday that whether the recent turbulence has affected aggregate demand in Australia cannot be answered yet. Thus, in the minutes we will look on whether this view is shared among all council members.
• During the European day, the main event will be the UK CPI for January. The forecast is for a slight acceleration in the headline figure, but a minor slowdown in the core reading, which reflects energy-related base effects. The decline in gasoline prices in January was less than it was last year, which could provide a temporary boost to inflation due to the CPI calculation. In the minutes of the latest BoE meeting, officials judged that CPI inflation is likely to remain below 1% until the end of the year, as a result of the recent fall in commodity prices. Therefore, we believe that a minor rise in the inflation rate due to base effects may be not be enough to boost inflation expectations, as it may be viewed as temporary.
• From Germany, the ZEW survey for February is forecast to show a decline in both the current situation and the expectations indices. The persistent negative sentiment over global growth and may have weighed on the optimism of German businesses. This could put the common currency under renewed selling pressure.
• On Wednesday, we get the UK employment report for December. The unemployment rate is forecast to have declined for the sixth consecutive month, but average weekly earnings are expected to have slowed somewhat. Although the decline in the jobless rate continues to point a tightening labour market, we believe that investors will pay more attention on wages. Further slowdown in wages may hit inflation expectations and could prove negative for the pound.
• In the US, the Fed releases the minutes of its January 26-27 meeting. At this meeting, the Committee refrained from raising interest rates as was widely expected, while in the statement accompanying the decision, officials noted that they are monitoring international developments and how those may affect the US economy. Since the meeting, the uncertainty surrounding financial markets has increased and concerned comments from several Fed members, including Chair Yellen, have eliminated any market expectations for a March hike. Therefore, we believe that the minutes are likely to be viewed as outdated and the reaction in USD could stay muted.
• On Thursday, Australia’s unemployment rate is expected to have remained unchanged in January, while the net change in employment is expected to have increased. In his recent speech before the parliament, RBA Governor Stevens said that the labor market improved more than expected, but it remains to be seen whether that strength would continue. As a result, further improvement in Australia’s labor market may push back market expectations for a rate cut by the RBA in March. This could prove AUD-positive.
• From China, we get the CPI and PPI data for January. The CPI is expected to have accelerated, while the PPI rate is expected to have fallen at a slower pace than previously. The indicators will be watched closely, as low inflation in China is one of the main causes of global deflationary pressures. Any signs of a soft reading could put more pressure on the PBoC to introduce further stimulus and may bring AUD and NZD under renewed selling interest.
• On Friday, the main event will be the US CPI data for January. The CPI figure is expected to have accelerated significantly, partly due to energy-related base effects in the CPI calculation. Given that the Fed has implicitly signalled that rate hikes are currently on hold while policy makers assess the impact of the international turmoil on the US economy, any acceleration in the inflation data could bring forward some expectations for near-term hikes. We expect that even a strong acceleration in inflation would be insufficient to revive market hopes for a March hike, but it may be enough to increase the odds for April or May. This could cause the greenback to regain some of its lost glamour.
• From Canada, the CPI data for January are forecast to show that inflation accelerated further and is now very close to the BoC target. The expected rise could mainly reflect energy-related base effects and upward price pressures from a weakening CAD. This could support the Loonie a bit.
• The European council will also meet, and amongst the main points of discussion will be the UK in/out referendum and the draft deal proposed by the EU to British PM Cameron. The meeting will be closely watched as a proxy for the likelihood of a “Brexit”. A non-agreement between the EU and the UK could dramatically increase the chances for a Brexit and bring GBP under renewed selling interest.
The Market
EUR/USD continues its slide
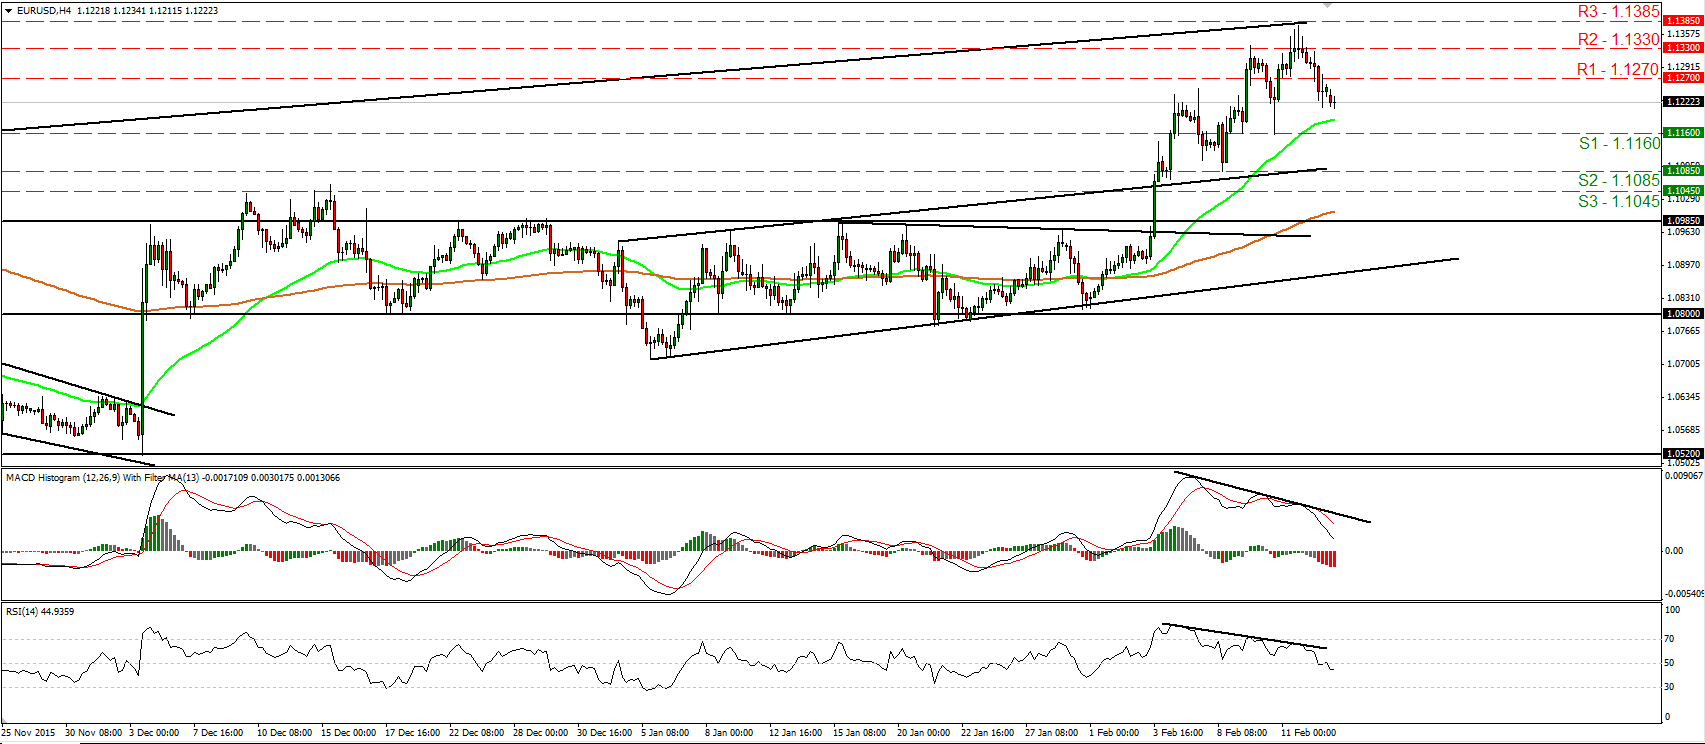
• EUR/USD traded south on Friday, falling below the support (now turned into resistance barrier) of 1.1270 (R1). Given that on the 3rd of February the pair emerged above the 1.0985 hurdle, which is the upper bound of the sideways range it had been trading since December, I still see a somewhat positive short-term picture. However, for now I see signs that the setback is set to continue for a while. I would expect sellers to aim for the 1.1160 (S1) support hurdle and if they are strong enough to overcome it, they could drive the battle towards the next obstacle of 1.1085 (S2). Our short-term oscillators support the notion as well. The RSI fell below its 50 line, while the MACD, although positive, stands below its trigger line and is headed towards zero. There is also negative divergence between these two indicators and the price action. Switching to the daily chart, I see that the rate started sliding after it hit the prior upside support line taken from the low of the 13th of March 2015. This is another reason that amplifies the case for further retreat in the near term. However, as long as EUR/USD is trading between the 1.0800 key zone and the psychological area of 1.1500, I would keep the view that the broader trend remains sideways.
• Support: 1.1160 (S1), 1.1085 (S2), 1.1045 (S3)
• Resistance: 1.1270 (R1), 1.1330 (R2), 1.1385 (R3)
GBP/JPY breaks above a short-term downtrend line
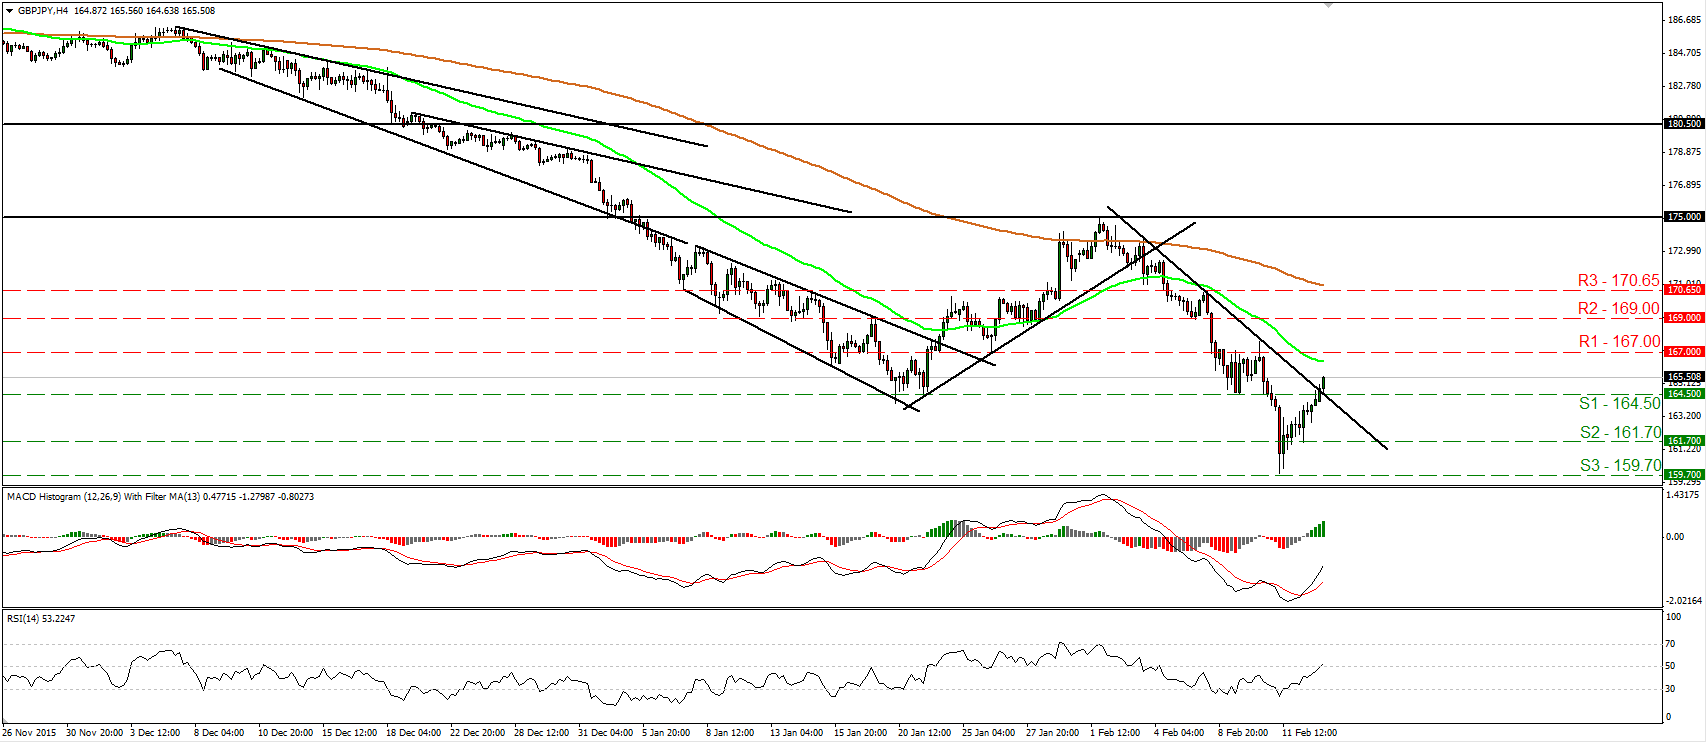
• GBP/JPY edged higher on Friday and managed to overcome the short-term downtrend line taken from the peak of the 3rd of February. This has turned the near-term outlook somewhat positive and thus, we may see buyers challenging the 167.00 (R1) line very soon. A move above that zone could set the stage for more extensions, perhaps towards the 169.00 (R2) territory. Our momentum studies detect upside momentum and corroborate my view for further near-term advances. The RSI has just poked its nose above its 50 line, while the MACD, although negative, stands above its trigger line and looks to be headed towards zero. On the daily chart, the price structure still suggests a longer-term downtrend. Therefore, I would treat the recovery from 159.70 (S3), or any extensions of it, as a corrective phase for now.
• Support: 164.50 (S1), 161.70 (S2), 159.70 (S3)
• Resistance: 167.00 (R1), 169.00 (R2), 170.65 (R3)
AUD/USD breaks above 0.7125
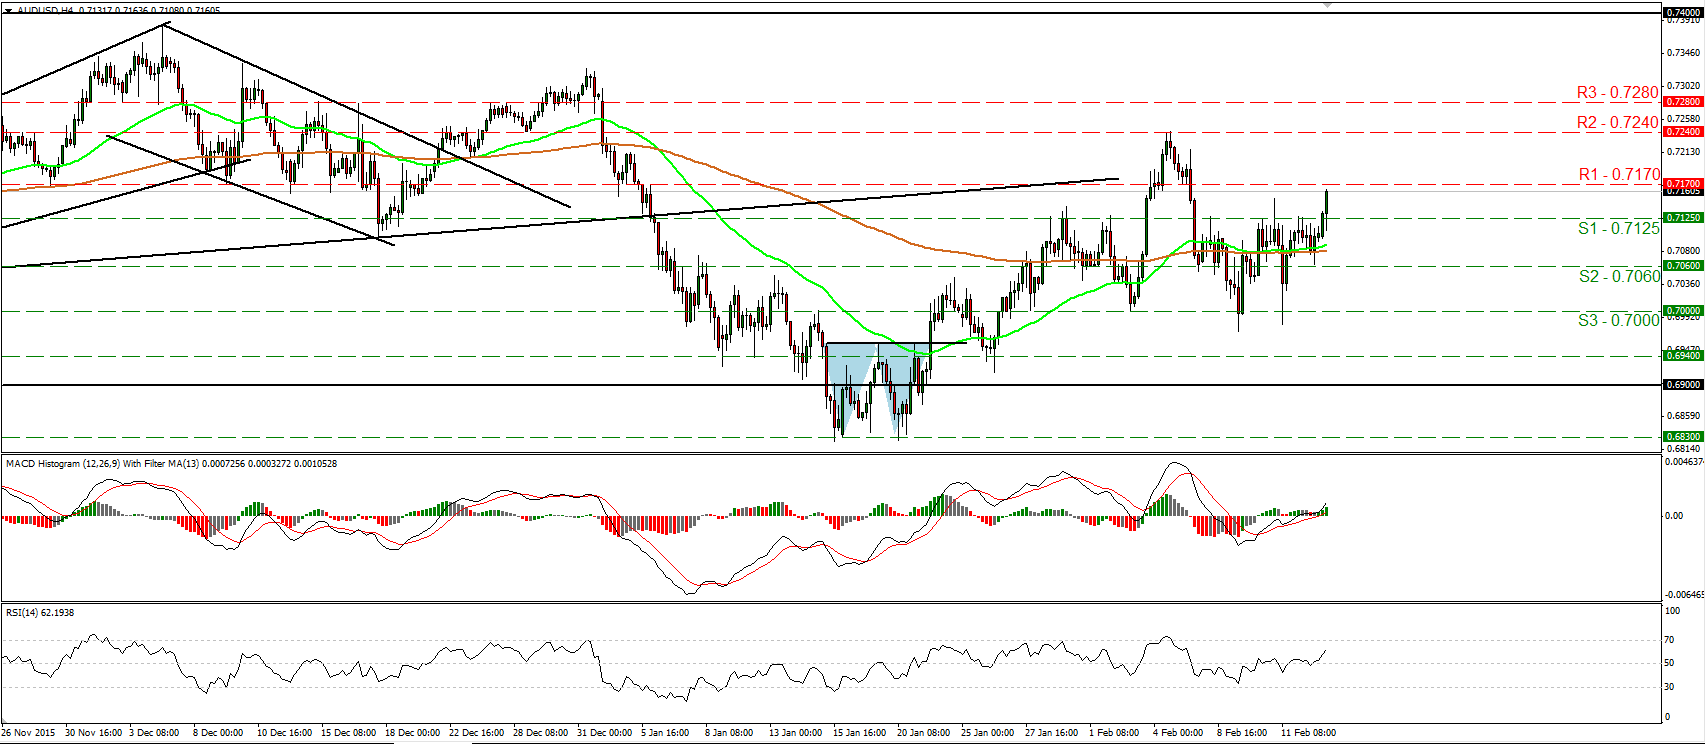
• AUD/USD surged during the Asian morning Monday, breaking above the resistance (now turned into support) territory of 0.7125 (S1). The rate now looks to be headed towards the 0.7170 (R1) hurdle, where an upside break could see scope for more bullish extensions, perhaps for a test at the 0.7240 (R2) territory, defined by the peak of the 4th of February. Our short-term oscillators detect upside speed and corroborate my view. The RSI rebounded from near its 50 line and is now headed towards its 70 line, while the MACD stands above both its zero and trigger lines, and points up. As for the bigger picture, given that the rate is trading back within the sideways range between 0.6900 and 0.7400, I would hold a “wait and see” stance as far as the medium-term bias is concerned.
• Support: 0.7125 (S1), 0.7060 (S2), 0.7000 (S3)
• Resistance: 0.7170 (R1), 0.7240 (R2), 0.7280 (R3)
Gold slides and hits support at 1215
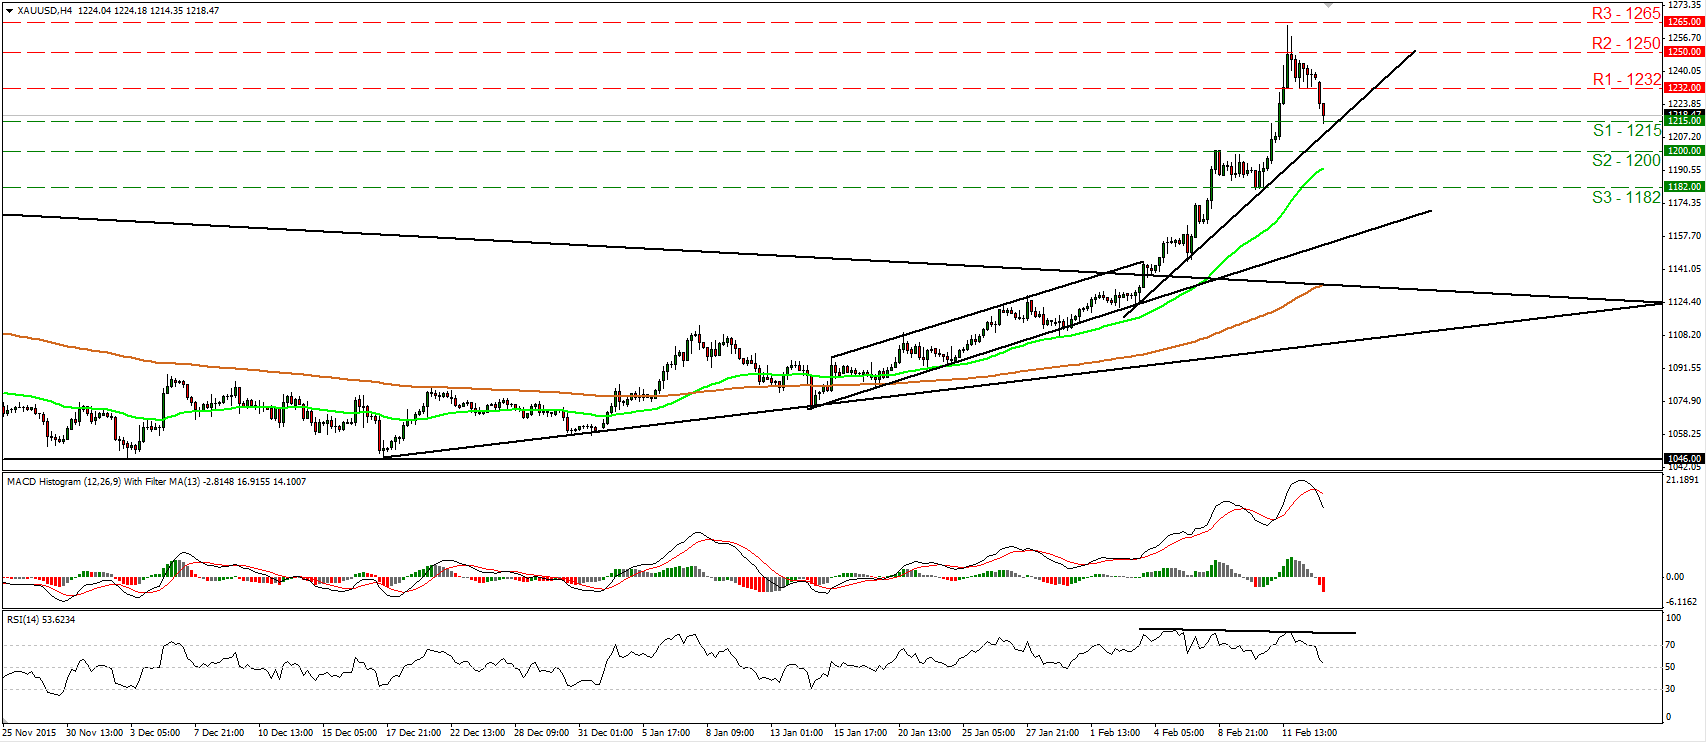
• Gold slid on Friday, breaking below the support (now turned into resistance) line of 1232 (R1). Nevertheless, the decline was stopped at 1215 (S1), slightly above the short-term uptrend line taken from the low of the 3rd of February. The fact that the metal remains above that trend-line keeps the short-term outlook cautiously positive. Taking a look at our short-term oscillators though, I see signs that the current setback is not over yet. The RSI exited its overbought territory and is now headed towards its 50 line, while the MACD, although positive, has topped and fallen below its trigger line. There is also negative divergence between the RSI and the price action. A decisive dip below 1215 (S1) would bring the price below the aforementioned uptrend line and could initially aim for the psychological zone of 1200 (S2). Switching to the daily chart, I see that on the 4th of February, the price broke above the long-term downside resistance line taken from the peak of the 22nd of January 2015. As a result, I would consider the medium-term outlook to be positive and I would treat any further near-term declines as a corrective phase for now.
• Support: 1215 (S1), 1200 (S2), 1182 (S3)
• Resistance: 1232 (R1), 1250 (R2), 1265 (R3)
WTI rallies above 28.00
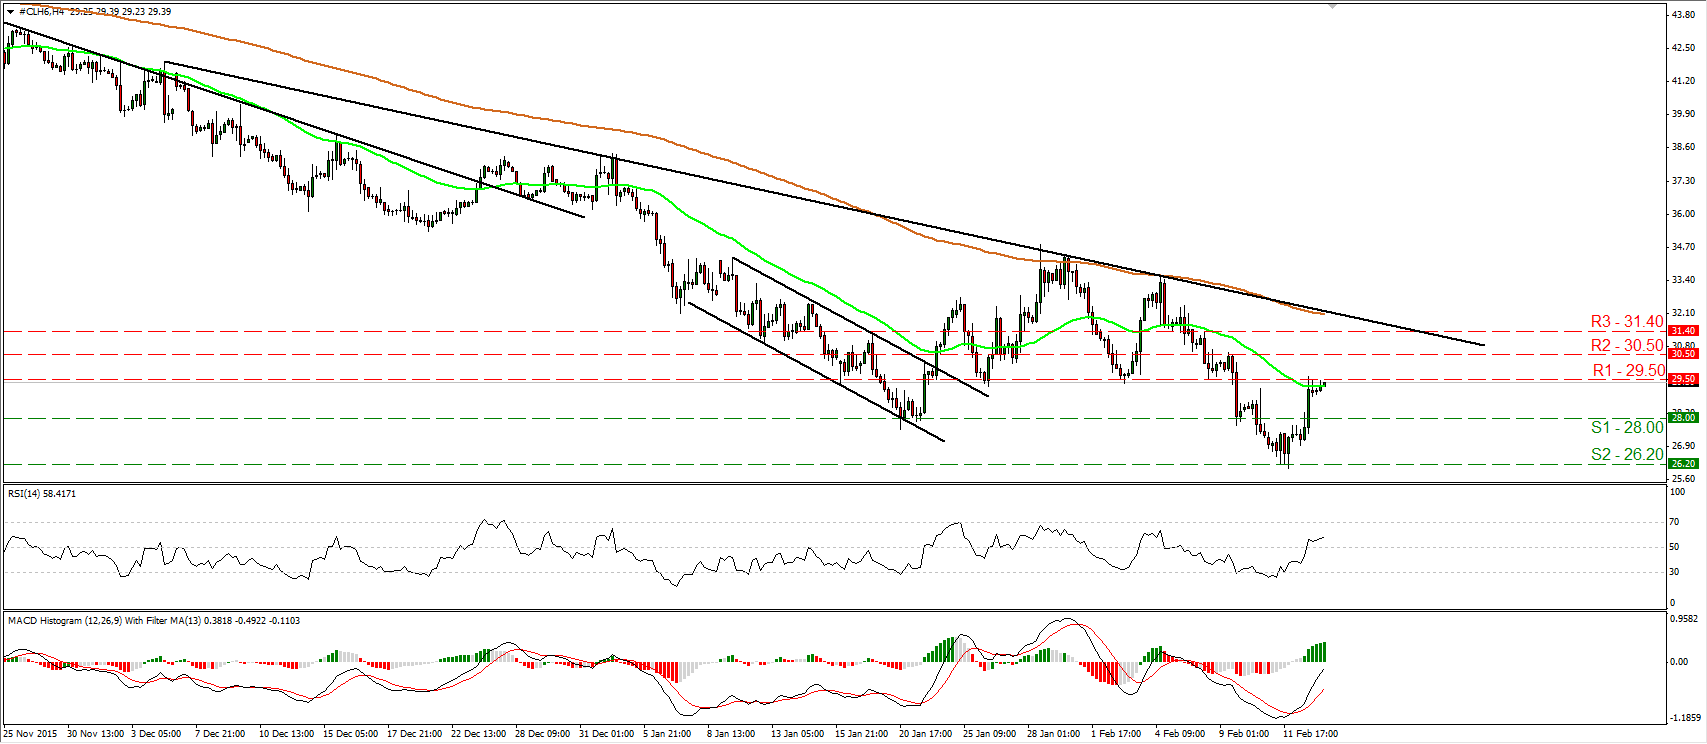
• WTI rallied on Friday, breaking above the resistance (now turned into support) line of 28.00 (S1). However, the advance was stopped by the resistance zone of 29.50 (R1). Given that the price is still trading below the downtrend line taken from the 4th of December, I would consider the outlook to stay negative. For now though, I see signs that Friday’s surge may continue a bit more. A break above 29.50 (R1) could initially aim for the 30.50 (R2) barrier. Our short-term momentum indicators support the case as well. The RSI emerged above its 50 line, while the MACD stands above its trigger line, points up, and looks able to challenge its zero line any time soon. On the daily chart, I see that WTI has been printing lower peaks and lower troughs since the 9th off October. Therefore, I would treat the recovery started on Thursday, or any extensions of it, as a corrective move for now.
• Support: 28.00 (S1), 26.20 (S2), 25.00 (S3)
• Resistance: 29.50 (R1), 30.50 (R2), 31.40 (R3)


