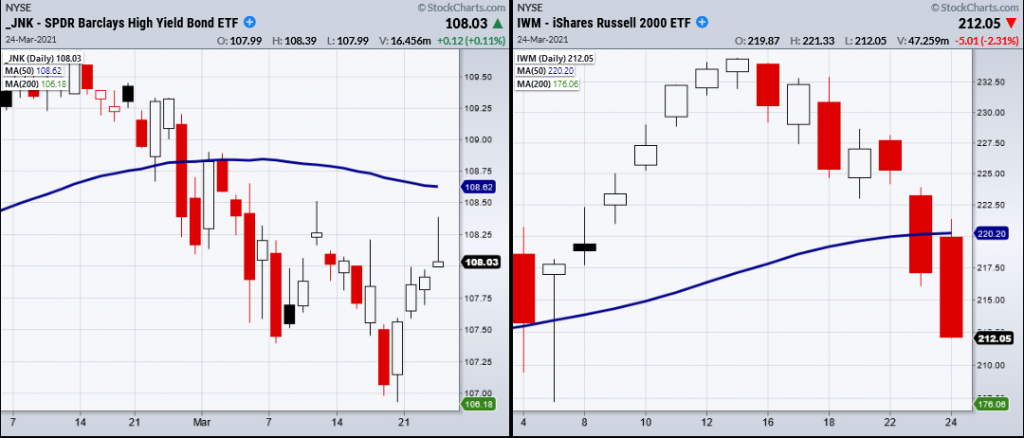
Wednesday, the Russell 2000 (IWM) confirmed a cautionary phase change with a second close under the 50-day moving average.
A cautionary phase is defined as having the current price sitting under the 50-DMA with the 50-DMA over the 200-DMA.

Both IWM and NASDAQ (QQQ) are in cautionary phases. This is important because the four major indices are split between bullish and caution phases.
Having said that, the next key support levels to watch are recent lows. For the QQQs, this would be last week's low at $309.66 and $207.21 for IWM. These are important areas to hold as they are within the recent trading range and can offer support for the market to spring back from.
However, while IWM and QQQ closed yesterday down, the high yield bond ETF—SPDR® Bloomberg Barclays High Yield Bond ETF (NYSE:JNK) was showing that buying pressure was still active. Wednesday, JNK closed green for the day and has been able to hold over its 10-DMA at 107.83. If buyers continue to step up, the next resistance level to clear would be 108.62 from the 50-DMA.
Because high yield bonds are riskier investments, this shows that some investors are seeing this market pullback as a buying opportunity. Whether that is the correct approach remains to be seen, but at least we know which areas to watch for the market to hold or clear over.
To add one last piece of information into the fray, MarketGauge’s proprietary risk indicator has recently shifted from a neutral standpoint to risk off.
If the indicator stays in the risk off position, going to cash or holding risk adverse positions might be the safest plan for the moment.
ETF Summary
- S&P 500 (SPY) 385.80 next support the 50-DMA.
- Russell 2000 (IWM) Confirmed cautionary phase with second close under the 50-DMA at 220.20.
- Dow (DIA) Next support area 320.
- NASDAQ (QQQ) Watching 309.66 to hold.
- KRE (Regional Banks) 50-DMA at 62.82.
- SMH (Semiconductors) Needs to hold 227 area.
- IYT (Transportation) If it cannot hold 245 area, watch 240 next.
- IBB (Biotechnology) Main support is the 200-DMA at 144.54.
- XRT (Retail) 50-DMA 81.83.
- Volatility Index (VXX) Watching. 10-DMA at 13.02.
- Junk Bonds (JNK) Weak hold over the 10-DMA at 107.81. Resistance 108.62.
- LQD (iShares iBoxx $ Investment Grade Corp Bond ETF) 130.06 gap to fill.
- IYR (Real Estate) 90.00 pivotal area.
- XLU (Utilities) 63.45 resistance.
- GLD (Gold Trust) Holding its range.
- SLV (Silver) Needs to consolidate.
- VBK (Small Cap Growth ETF) Needs to get back over 265.
- UGA (US Gas Fund) 29.82 support the 50-DMA.
- TLT (iShares 20+ Year Treasuries) Watch to fill gap at 138.46.
- USD (Dollar) Sitting in resistance at 92.60 the 200-DMA.
- EWW (Mexico) Watching for second close under the 50-DMA at 42.70.
- MJ (Alternative Harvest ETF) Broke the 50-DMA at 22.63.
- WEAT (Teucrium Wheat Fund) Needs to hold 6.
