Most of the major global indices have recently hit new all-time highs within the past several months as equity markets across the globe have continued to display dramatic strength.
While such strength in benchmark indices such as the FTSE 100, Dow, S&P 500, and German DAX has been an encouraging sign for international economies, it is hard to imagine any financial market rising indefinitely without interruption.
In market dynamics, an interruption usually comes in the form of a correction – a substantial counter-trend move that corrects market over-extension. Most of the major global indices have been well overdue for a correction for at least the past few months.
Let’s look at the latest movements…

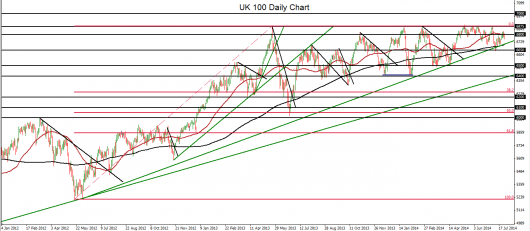
The UK 100 (daily chart shown) has been fluctuating for the past week around its 50-day moving average, just under its multi-year highs.
It’s regained some ground after having declined modestly from the major 6875-6885 resistance zone in early July down to key support around 6650, then rebounding from that support area. The rebound also bounced off a long-term uptrend line extending back to the mid-2012 lows.
Having turned down from a high of 6875 more than three weeks ago, the UK 100 has continued to reinforce the noted 6875-6885 resistance zone, just below May’s 6896 peak – which was almost a 15-year high for the index.
Aside from that 6896 long-term high, the 6875-6885 resistance area has held strongly for more than a year, during which time it has been tested and respected on several occasions.
The UK 100 index continues to be strongly entrenched in a major bullish trend, despite the resistance area immediately above.
Currently trading on the upper end of a range between its 50-day moving average to the upside and 200-day moving average to the downside, the UK 100 continues to maintain its bullish trend for the time being, although a deeper pullback or correction has been well overdue.
Although the drop from 6875 down to 6641 during the first half of July constituted the most substantial pullback thus far since March, the index continues to be significantly overbought on a short-term basis, much like most of the other major global indices. If the 6875-6885 resistance level endures as the major upside barrier, a more extensive pullback or correction within the prevailing bullish trend could soon be in order.
In the event of a major breach below the noted 6650 support level, a deeper pullback could push the index down to a key support target around the important 6500 level, which was last hit in mid-April.
To the upside, the resistance area to watch continues to be the 6875-6885 zone, a breach above which could signal a continued bullish trend with its next upside target around the 7000 psychological level.
US S&P 500

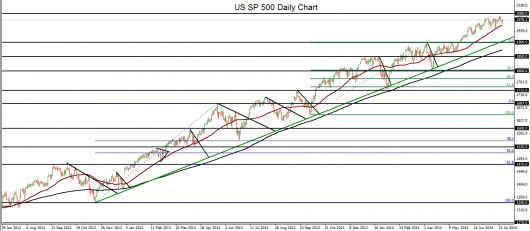
The US S&P 500 (daily chart shown above) has continued its rise to progressively higher record levels on almost a weekly basis, despite a market environment that many have deemed long overdue for a correction.
While the US equity markets have been entrenched in a bullish trend for over five years, the past two years have displayed a particularly strong and steady climb.
During a consolidation and pullback in March and April, the question was asked repeatedly by many as to whether the S&P 500 would first breach 1800 to the downside for a correction or 1900 to the upside for a continued bullish run.
That answer came in May, when the index easily broke 1900 and has hardly looked back since. Since even before that breakout, the index has been trading consistently above its 50-day moving average and far above its 200-day moving average – both of which continue to rise in tandem. The last significant pullback within the current bullish trend occurred during the first half of April, when the index fell by a mere 4% from its high at that time of around 1897, far short of the 10% generally used to define a full correction.
The last time a full correction actually took place was during April and May of 2012.
Currently nearing its long-term upside target around the previously uncharted 2000 psychological level, the US SP 500 continues to be due for a strong pullback or correction, despite the virtually one-directional moves seen in the past few months.
A turn back down from around the noted 2000 level and then a strong breakdown below the 50-day moving average could signal such a pullback/correction, with the 1900 level serving as the major initial support target to the downside.
Wall Street

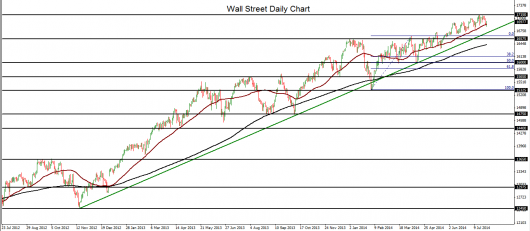
Wall Street (daily chart shown above) has mirrored its US equity index counterpart, the US SP 500, in its relentless rise within the past several months, as well as the past several years.
Having generally traded above its 50-day moving average for the past three months, like the S&P 500, the Dow continues to set new record highs on a frequent basis. The most recent record-breaking, all-time high was around 17150 just a few weeks ago in mid-July.
As the index continues to trade above its 50-day moving average and far above its 200-day moving average, with both averages pointing steeply to the upside, there is an indication of a potential over-extension and possible impending pullback.
The most significant recent pullback occurred early in the year, when the index fell from around 16570 in the beginning of the year down to around 15340 in early February for almost a 7 ½% decline in two months.
Although this did not quite constitute a bonafide correction, it was the largest percentage decline since the end of 2012.
With price action trading near its new all-time highs, Wall Street could well be due for just such a pullback, if not a full correction.
In the event that the index begins to trade consistently below its 50-day moving average and then breaks below the key uptrend support line that extends back to the late 2012 low, declining price action could then target key downside support levels around 16500 and then 16000 to fulfill an overdue retracement.

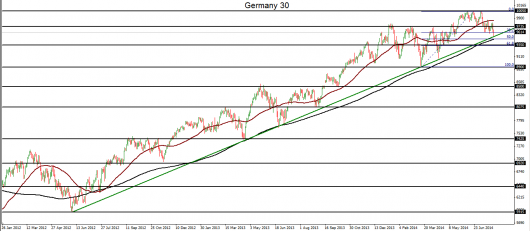
Germany 30 (daily chart shown above) has just pulled back to an often-tested uptrend support line extending back to the 5912 low of June 2012.
This pullback occurs after the German index hit a triple-top pattern slightly above 10000 in June and early July, with a record all-time high of 10048 at the second top in June.
Since the triple-top resistance was hit in the past couple of months, the index has declined to its current position in the mid-9000s, having pulled back by over 5% from its highs so far.
The largest decline in the recent past occurred in February and March, when the index dropped from a high of 9733 down to a low of 8908, for a pullback of almost 8.5% in less than a month.
Although this was a substantial decline, Germany 30 continued to stay well within the bounds of its longstanding bullish trend and above the noted uptrend support line.
At the current time, the index is also still above the uptrend line, although it is now trading well below its 50-day moving average and only slightly above its 200-day after the pullback. The 200-day moving average has been closely mirroring the uptrend line for around two years.
The key technical catalyst to watch for would be any breakdown below the noted uptrend line and 200-day moving average. In this event, a correction could potentially be in the making, with a downside target around the 8900 support level.
To the upside, any significant rebound and recovery of the current pullback could push the index back up towards another re-test of its triple-top highs just below 10050.
Disclosure: FX Solutions assumes no responsibility for errors, inaccuracies or omissions in these materials. FX Solutions does not warrant the accuracy or completeness of the information, text, graphics, links or other items contained within these materials. FX Solutions shall not be liable for any special, indirect, incidental, or consequential damages, including without limitation losses, lost revenues, or lost profits that may result from these materials.
The products offered by FX Solutions are leveraged products which carry a high level of risk to your capital with the possibility of losing more than your initial investment and may not be suitable for all investors. Ensure you fully understand the risks involved and seek independent advice if necessary.
