Yes, I’m writing another post about bonds. I think it’s an important topic because just about everyone is expecting bond yields to go to the moon as they call for the end of the 30+ year bond bull market. When there’s this much ‘group think’ to a single topic I begin looking for reasons why it’s wrong. I did it with Tech, when people were making jokes that semiconductors were trading like they cured cancer and how amazing the tech sector was. While long-term I agree tech has some great prospects, I believe I may have been one of the few people who turned cautious on tech based on its stretched relationship with the broad market in my post Has The Technology Sector Run Too Far Too Fast?, just before we saw markets fall and re-test the February levels, lead on the downside by the S&P 500 largest weighted sector, Technology.
Okay, back to one of the most hated markets right now… bonds. 10-year Yield broke 2.8% yesterday, let’s dive into why it could keep going lower.
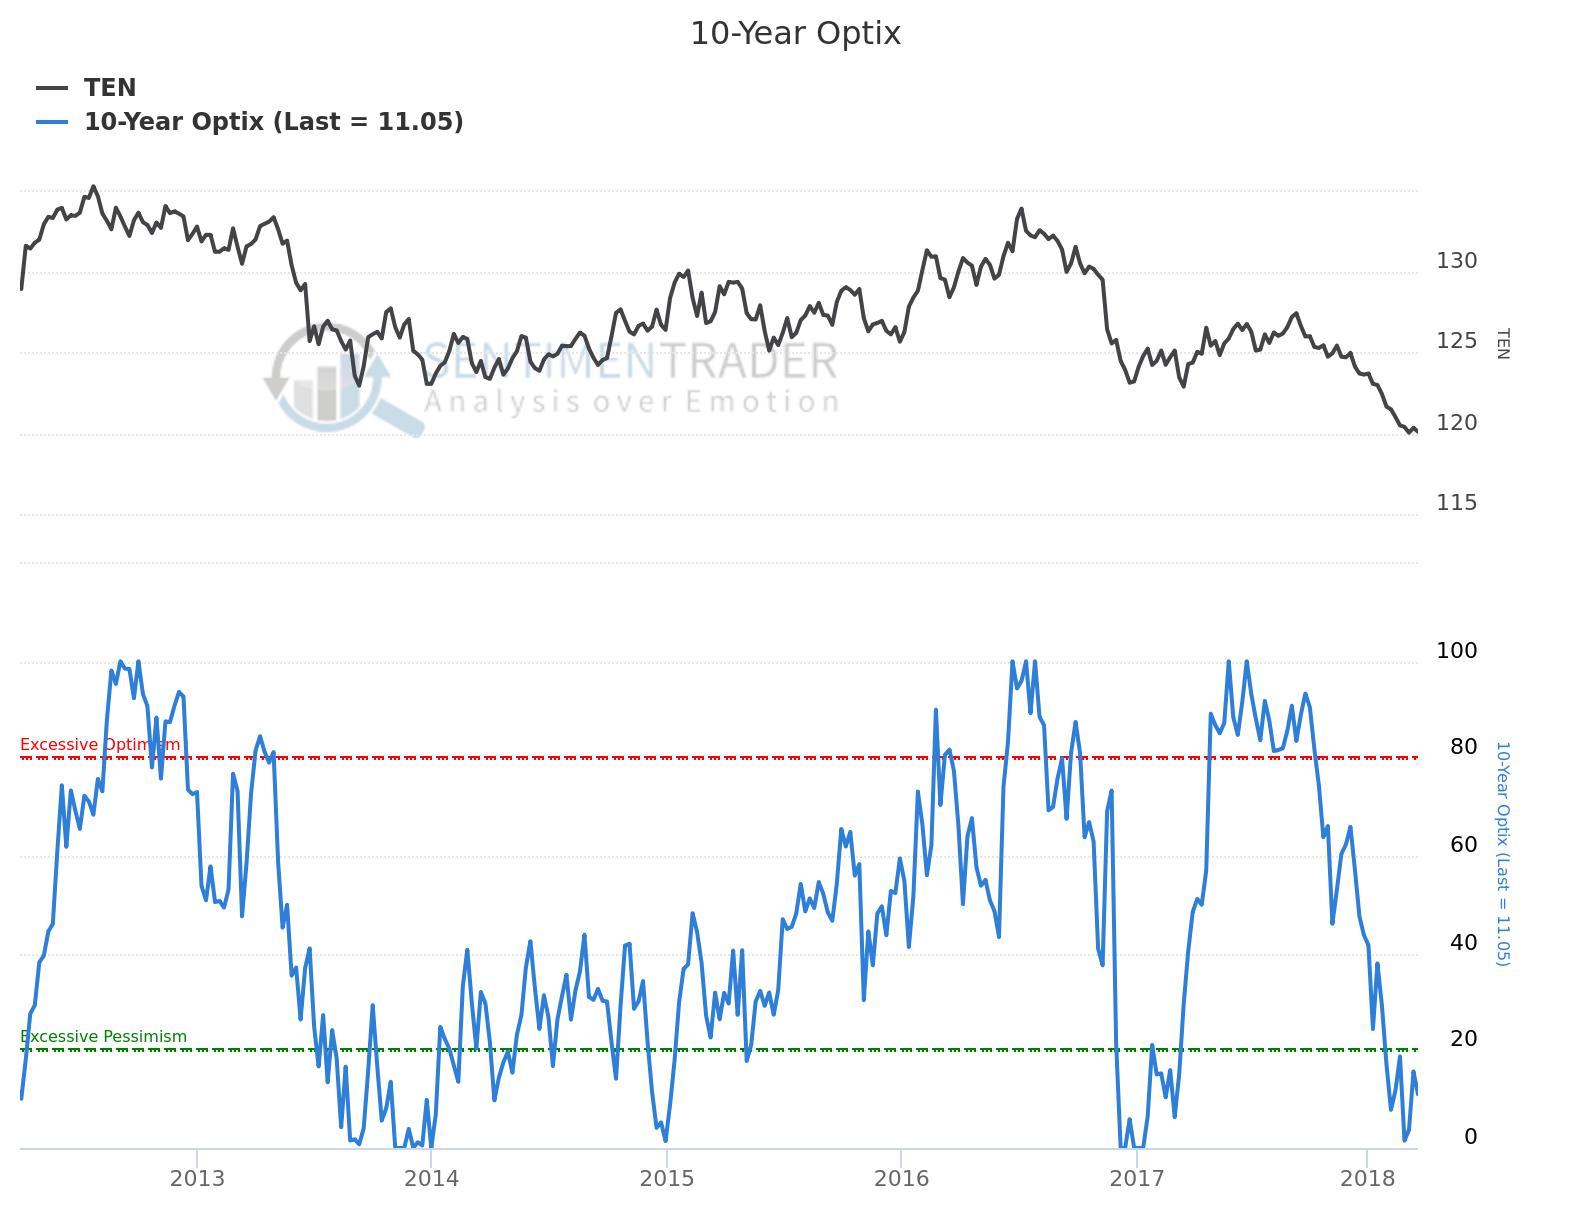
First, we have sentiment, as I mentioned, is at record low bullishness for bonds. Here’s a chart from SentimenTrader showing his Optimism Index. Currently nearly the lowest levels seen in the last 5 years. We last saw extremely low sentiment in 2017 before the 10-year Treasury rallied.

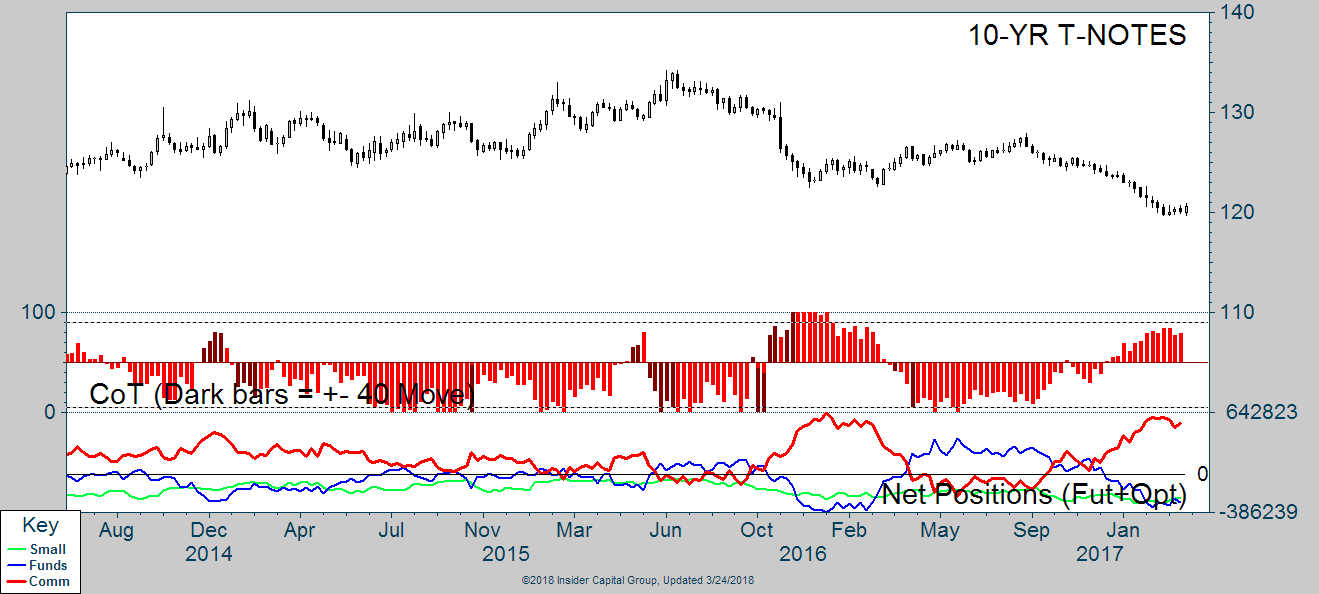
Next lets take a look at how bond traders are positioned. Below is the Commitment of Traders chart for 10-year Bonds, the bottom panel shows the red line, Commercial Traders, are holding a very large net-long position, while large traders and small traders are who are taking the other side by being net-short. If we were to look at 30-year Treasury’s, we’d see that it was just the small trader group (individual traders mostly) that are net-short, while Commercials and Large Traders are net-long/flat right now.

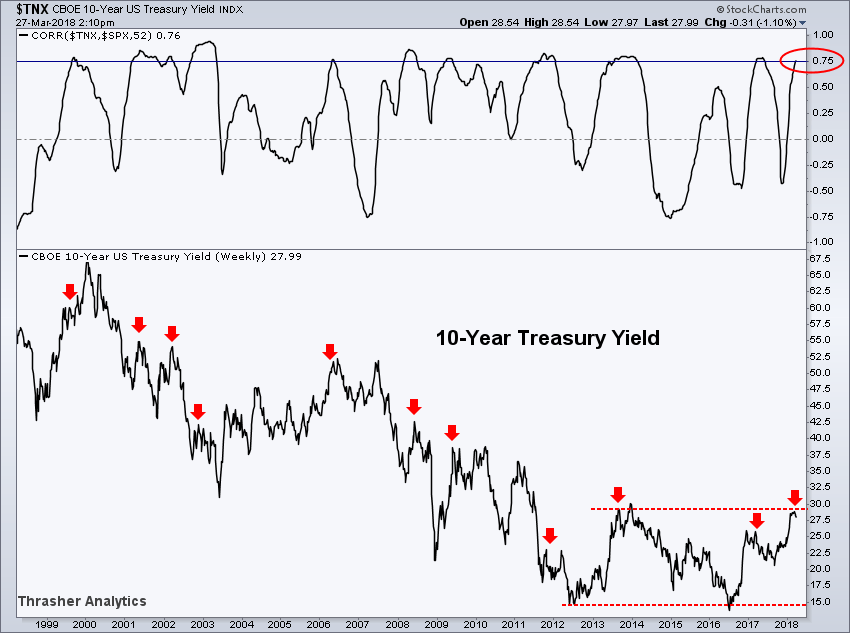
Finally, the main chart I wanted to share and that’s the correlation of the 10-year Treasury Bond Yield with the S&P 500. This is looking specifically at the 1-year correlation between the two, which has been steadily rising for several weeks and now sits at 0.76. As the chart shows, going back to the late-90s, bond yields have struggled to stay elevated after their correlation to the equity market has gotten this high. While a break above 0.75 has not marked the exact high of yields, it’s created a very tough environment for bond traders to continue to sell and push yields higher.
We also have a technical resistance level to contend with for TNX, with 3% was the high in 2013 before traders turned bullish on bonds sending yield back near 1.5% over the next three years. If we are in fact seeing the end to the bond bull market then this resistance level should get taken out as yield continues to march higher and bond prices going lower.

With the major U.S. equity indices testing prior important support levels of the February low and the 200-day Moving Average (for the S&P 500), bond levels become that much more important as managers evaluate their risk tolerances. I also thin it’s important to not disregard the weakness being seen in the copper-gold ratio, which I tweeted an updated chart of on Tuesday. I’m hesitant to be as confident as many other traders appear to be in thinking the 10-year yield will continue moving higher without any kind of consolidation or back-and-fill. With equities taking a bunch, I think bonds may get emboldened and we see buyers step back into fixed income. We’ll see what the market throws at us going forward…
Disclaimer: Do not construe anything written in this post or this blog in its entirety as a recommendation, research, or an offer to buy or sell any securities. Everything in this post is meant for educational and entertainment purposes only. I or my affiliates may hold positions in securities mentioned in the blog. Please see my Disclosure page for full disclaimer.
