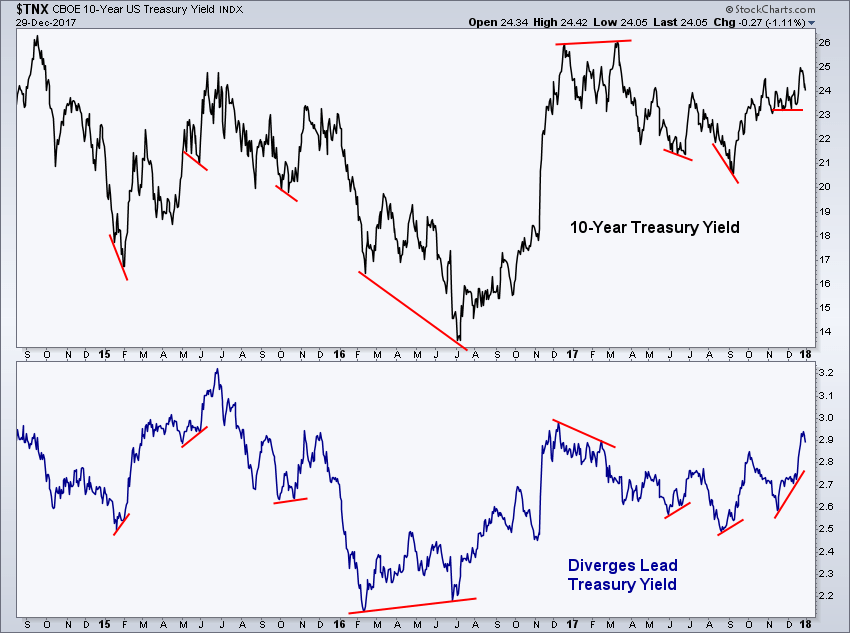
While preparing the newsletter for our subscribers, I thought I’d share one of the charts that’ll be sent out in this weekend’s note.
Below is a chart from late-2014 through 2017 with the 10-year Treasury Yield in the top panel and a positively correlated market in the bottom panel. While there are many ways to slice up the fixed income market, like any chart I review, I prefer to look when price action is not being confirmed. These divergences (for example: higher lows vs. lower highs) tell us that two markets or securities are in disagreement of the direction of the trend. When two typically positively correlated markets disagree, we can gain valuable information in a possible trend change.
That’s what we have here with the 10-year Treasury Yield (TNX). For example, a large divergence was formed in mid-2016 as the Treasury yield was making a new low under 1.4%, while our leading market was seeing strength, making a large higher low. That ended up marking the bottom in yield as it eventually rose up near 2.6% when another divergence began to play out. In March ’17 a slightly higher high was put in for TNX as our leading market was weakening and making a lower high. Yield eventually followed suit and declined to near 2%. As you can see on the chart, several divergences of varying degrees have been formed over the last few years, giving ample notice to a trend change in fixed income.
Fortunately we don’t have to stop there. We can can take this a step further in using tools to find potential trend changes in our leading market as well, providing more notice to potential changes in Treasurys. In my Thrasher Analytics note I go into more detail of this chart and whether we’re seeing confirmation of the latest move in yield or if a divergence has been formed. I thought this would act as a good example of a what I cover, in addition to my main focus of the Volatility Risk Trigger, for subscribers.
Disclaimer: Do not construe anything written in this post or this blog in its entirety as a recommendation, research, or an offer to buy or sell any securities. Everything in this post is meant for educational and entertainment purposes only. I or my affiliates may hold positions in securities mentioned in the blog. Please see my Disclosure page for full disclaimer.

