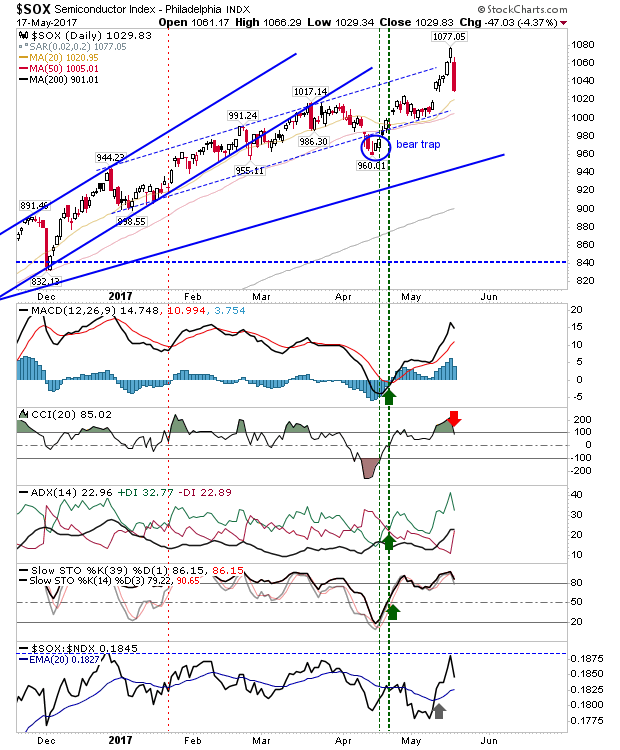
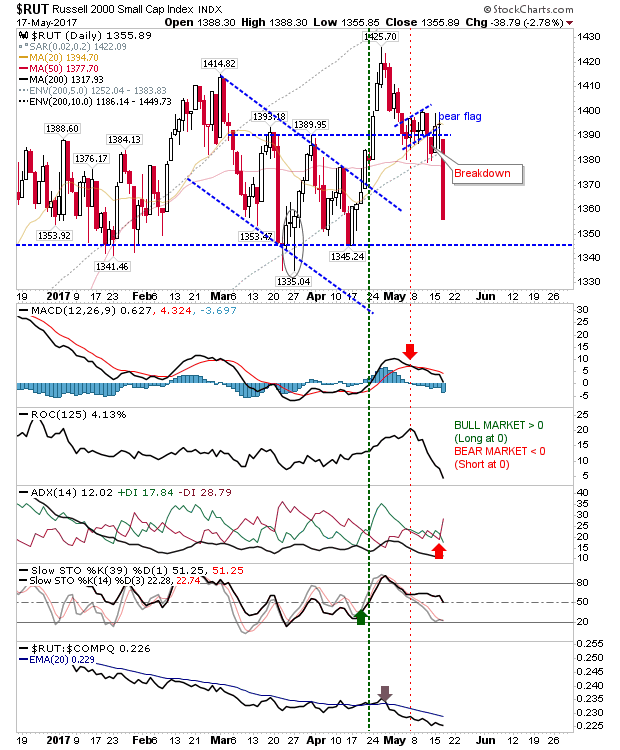
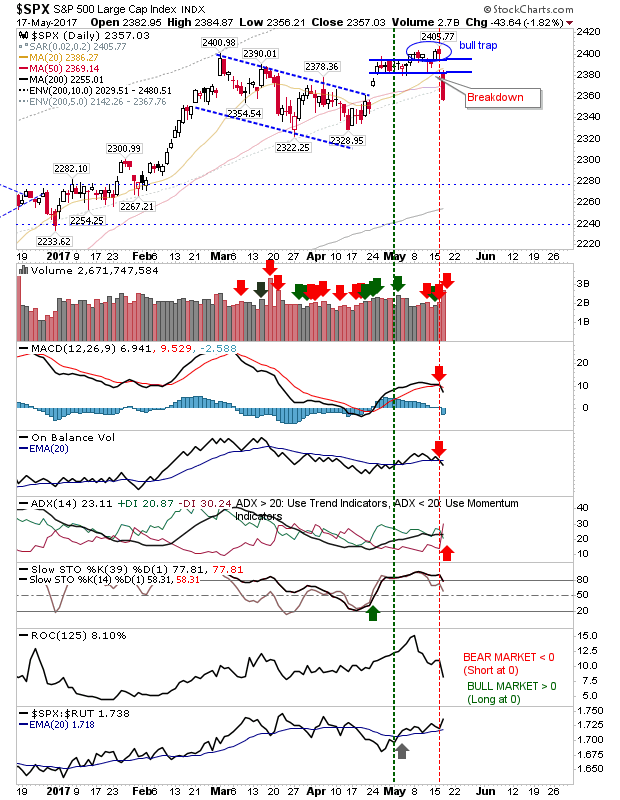
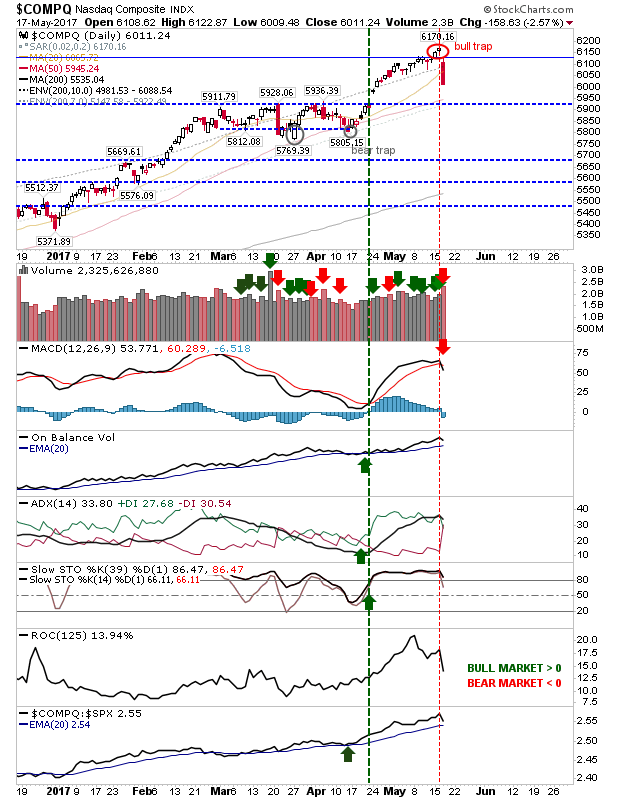
After days of steady gains, it was surprising to see the level of selling on show yesterday; the last day like yesterday in the markets was last December. How the action from yesterday plays out in the long-term is still up for grabs as key trading ranges haven't been breached. Shorts will be watching for opportunities, but what followed last December was another kick start for the rally—so bulls have a reason for optimism.
The biggest reversal was in the Semiconductor Index. Tuesday's 1.5% gain was whipped by a 4.4% loss. The attempt to break out of the rising channel was snapped away, putting the breakout gap from last week under pressure.

Next hardest hit yesterday was the Russell 2000. This is of particular concern given the importance of speculative Small Caps in leading secular bull markets. The trading range with support at 1,345 is there to lean on and today could be the day this support is tested. Technicals are mixed, not helped by the sustained relative underperformance of the index against Tech averages.
It's still too early to call a top, but shorts may look to the next recovery rally as an opportunity to attack. In addition, while yesterday's percentage loss was the largest of the lead indices, the broader trading range remains unchallenged.

The S&P flashed a second 'bull trap', but this time the confirmation move against the rally was substantial and will not be easily reversed. The loss of both 20-day and 50-day MAs increase the pressure. To add to the trouble, there were 'sell' triggers for the MACD, On-Balance-Volume and +DI/-DI.

Finally, the NASDAQ also had its 'bull trap'. Technicals are stronger for this index, a MACD trigger 'sell' the only reversal on this front. There was higher volume distribution to accompany yesterday's selling. A move to the 50-day MA may be the chance for bulls to get aggressive. Otherwise, long term holders may want to wait-and-see what happens.

For today, watch how markets react. The expectation is for a recovery given the extent of the loss, but profit-taking could intensify. Watch how support plays out in the NASDAQ and Russell 2000, as such support will likely see tests today.
