T2108 Status: 28.7%
T2107 Status: 35.2%
VIX Status: 13.4
General (Short-term) Trading Call: Neutral
Active T2108 periods: Day #192 over 20% (overperiod), Day #3 under 30%, Day #7 under 40%, Day #47 under 50%, Day #64 under 60%, Day #263 under 70%
Commentary
The market simply could not wait for the U.S. Federal Reserve to give its usual “all clear” signal this time around.
The Fed announces its next monetary decision today (Wednesday, July 29). The market looked like it was headed into true oversold conditions just in time to let the Fed work its powers of soothing. In the T2108 update for last Friday, I laid out all the bearish signs that had converged as T2108 hovered above oversold conditions. I was hoping that the S&P 500 (via the SPDR S&P 500 ETF (ARCA:SPY)) would retest support at its 200-day moving average (DMA) just as T2108 broke below 20% (oversold): such a combination would trigger my rules to aggressively buy the index. Instead, the index PERFECTLY retested its 200DMA (you can’t make this stuff up!) while T2108 stubbornly got only as low as 24%. T2108 did not even crack the low from the previous cycle of fear.
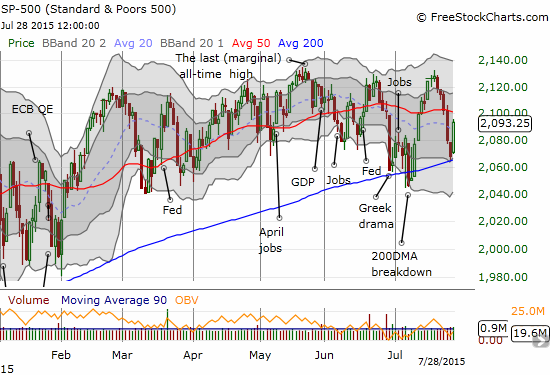
The S&P 500 completes a picture-perfect retest of 200DMA support with a subsequent rally of 1.2%
Although my ideal trading conditions did not trigger, I was still prepared to benefit from a bounce because the volatility index, the VIX, triggered the related “fade volatility” trade. On Monday, the VIX traded above the 15.35 pivot. With T2108 “close enough” to oversold (meaning it is below 30%), I nibbled on some put options on ProShares Ultra VIX Short-Term Futures (ARCA:UVXY).
I had expected to accumulate MORE puts on UVXY ahead of the Fed. Instead, I ended up taking profits as the volatility index plunged well below the 15.35 pivot.
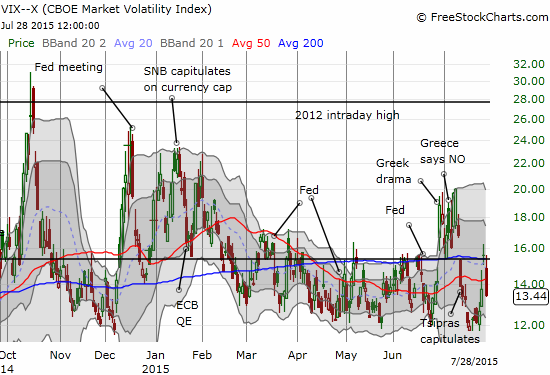
The volatility index (VIX) plunges 14% ahead of the Fed’s opportunity to reassure markets
The Australian dollar added confirmation that the market hit an important turn-around as it held steady against the Japanese yen. On Monday, AUD/JPY approached the previous low but did not break it.
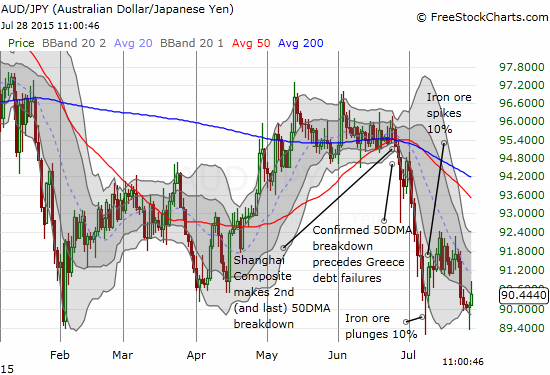
The Australian dollar holds support against the Japanese yen. A fresh breakdown would have flagged a freshly bearish signal.
Despite all these positive signs of a turnaround, I am definitely NOT giving the “all clear” signal just yet. The bearish signals that led to this latest encounter with oversold conditions are not yet invalidated.
For starters, the S&P 500 needs to at least close above its 50DMA; even better, it needs a new all-time high. AUD/JPY needs to clear recent congestion (say over 92.4) rather than get turned back like a brick wall. T2107, the percentage of stocks trading above their 200DMAs, rallied yesterday with the market but this longer-term signal remains BELOW the low of the last cycle of fear. I will be monitoring all these signals including the VIX.
I am NOT using the Shanghai Composite Index (SSEC) as a market signal, but I AM intrigued to see how well the market rallied yesterday even as SSEC gapped down to start trading in China and closed with another loss on the day. The Chinese government is clearly still watching the technicals closely. The gap down was stopped cold right at the 200DMA support. THIS stuff you CAN make up – at least the Chinese government can!
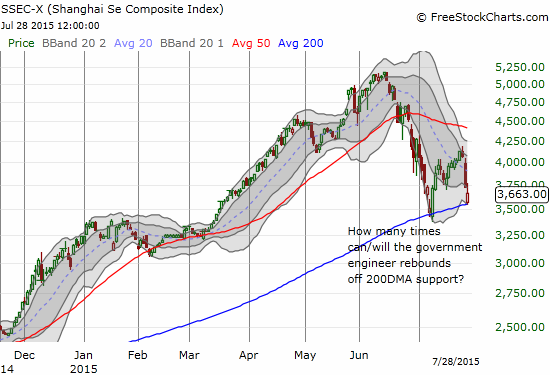
How long can the Chinese government keep the Shanghai Composite Index propped up with so much selling pressure and entry at such obvious buy points?
In other important/interesting trading action, I have Caterpillar (NYSE:CAT), Grub Hub (NYSE:GRUB), and Apple (NASDAQ:AAPL).
As regular readers know, CAT is my favorite hedge against market bullishness. Yesterday, however, it turned into my favorite play on oversold conditions. My trading mentor has created a fantastic stock scan website called SwingTradeBot. On Monday, one particular scan caught my eye:
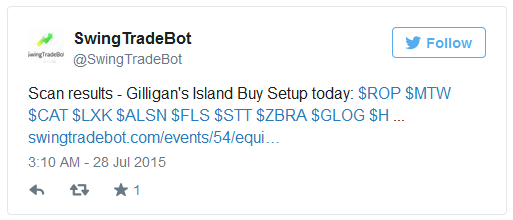
There was CAT! After seeing the stock had closed four days in a row below its lower-Bollinger® Band (BB), including a post-earnings gap down, I immediately put the stock on my buy list. This kind of selling pressure leads to oversold conditions and few stocks can sustain positioning beyond the BBs for long. Monday’s doji, aka a small body, is another classic bottoming sign that shows that buyers and sellers fought to a stalemate.
The term “Gilligan’s Island Buy Setup” is a bit silly and not intuitive. Here is the definition from a concept called “hit-and-run trading” from the book Hit & Run Trading: The Short-Term Stock Traders Bible. Copied from the SwingTradeBot site...
- A stock must gap open to a new two-month low. The bigger the gap the better.
- The stock must close at or in the top 50 percent of its daily range and equal to or above the opening.
- For the buy: The next day only, buy 1/8 point above today’s high.
- Risk 1 point.
- Carry the position overnight if it closes strongly.
CAT easily met the first two conditions with Monday’s close. Tuesday’s open met the third condition. Risking just over a point would break to a fresh multi-year low, so the fourth condition was easy. Given the strong open, and the high odds that an oversold bounce was underway, I loaded up aggressively on call options. I was prepared to hold until the close to test the last condition. Much to my surprise, in less than an hour, my position had already doubled in value, and CAT was up around 2.5%. Under THOSE conditions, I had to take the profit off the table in extreme gratitude. If I had waited for the last condition, I would have seen the position growth almost 4x as CAT closed up 3.3%.
The buying volume and trading action was SO strong that CAT effectively left behind an abandoned baby bottom. This pattern traps bears who chased the last gap down only to find themselves in an instant loss on a gap up the next day. The CAT bears are now under pressure to close and run. This pattern alone makes me more optimistic for the market in the short-term. THIS could potentially be the most important turn-around of all the turns I have shown in this T2108 Update.
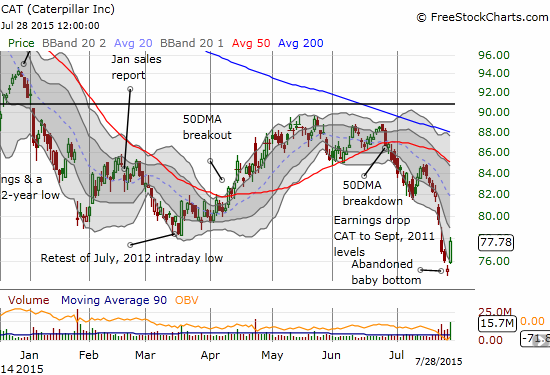
Caterpillar (CAT) sprints higher and leaves behind a STRONG bottoming pattern on equally strong buying volume. Shares traded on the day surpassed the previous selling days.
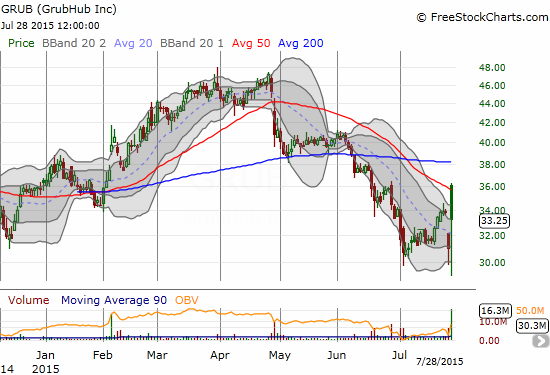
GrubHub (GRUB) had a chaotic day of post-earnings trading. The previous day, a downgrade instantly knocked the stock down to retest its all-time lows.
Traders and investors naturally feared that the downgrade indicated GRUB had very bad news in store. Instead, GRUB produced pedestrian numbers, far from alarming. The resulting gap up rammed the stock right into resistance at the 50DMA. Sellers went to work immediately from there.
It took me a while to understand what could be going on. And then I saw that a conference call was coming at 10am Eastern. So, essentially, whoever did not get a chance to panic and sell the day before was scrambling to use the post-earnings gap up to get out ahead of what HAD to be the real bad news. The stock made a fresh all-time low just ahead of the conference call. The stock bounced from there and chopped away to a net 7.2% gain on the day.
This action was a lesson in the dangers of panic. For me, it was also a lesson in patience as I rushed in to buy into yesterday’s panic. The subsequent bounce did allow me to get out with a gain, but I would have performed a LOT better by simply waiting for some (ANY!) sign of buying interest.
GrubHub (GRUB) violently trades around earnings
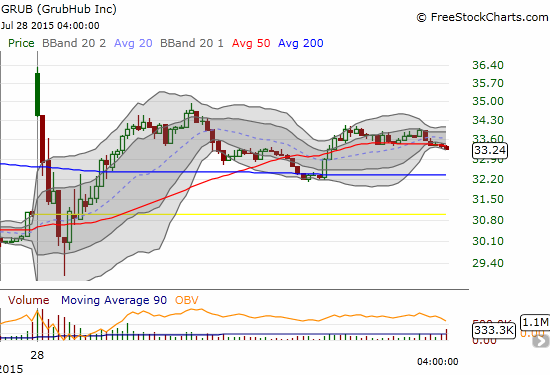
This 5-minute chart shows the sharp sell-off in the morning just ahead of the 10am conference call. Cooler heads prevailed in the end.
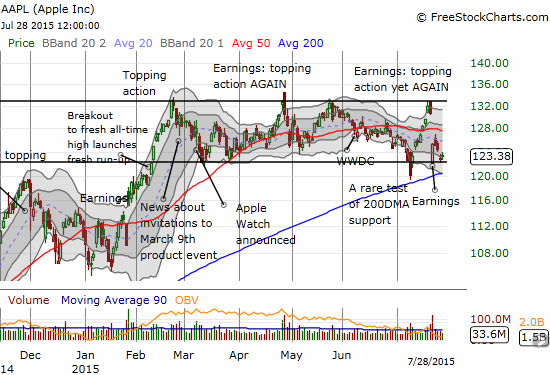
After all the pre- and post-earnings angst, Apple (NASDAQ:AAPL) is simply trading at the lower end of an on-going trading range. The 50DMA remains the presumed pivot within this trading range. I missed the nice surge off post-earnings lows. I am looking for another bounce off the bottom of the trading range. (I know I still owe readers an update on all the pre/post-earnings data on AAPL!)
Apple (AAPL) continues to stick by its trading range
Among yesterday’s scans from the SwingTradeBot is this one…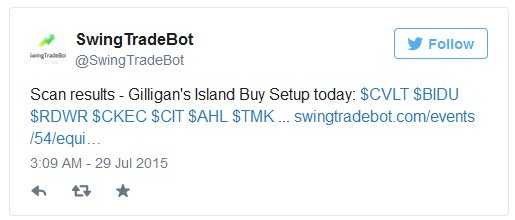
My eyes once again lit up. I know I said in “The Only Remaining China-Based Trade I Like” that I am going to leave Baidu (NASDAQ:BIDU) alone even with its tendency to bounce sharply from steep sell-offs. Given my experience with CAT, I am likely going to make an exception this time if BIDU meets the “Gilligan” criteria today. Stay tuned…!
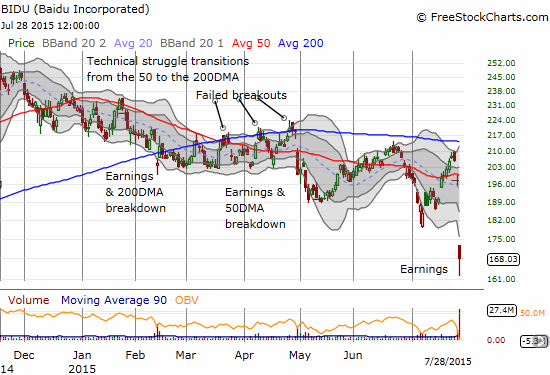
Sellers squash Baidu (BIDU) well below its lower-Bollinger Band. Buyers took BIDU 6 points off the low. Can it at least reach its pre-earnings low before sellers return?
Daily T2108 vs the S&P 500
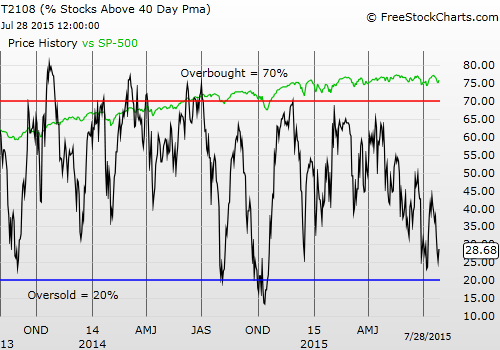
Black line: T2108 (measured on the right); Green line: S&P 500 (for comparative purposes)
Red line: T2108 Overbought (70%); Blue line: T2108 Oversold (20%)
Weekly T2108
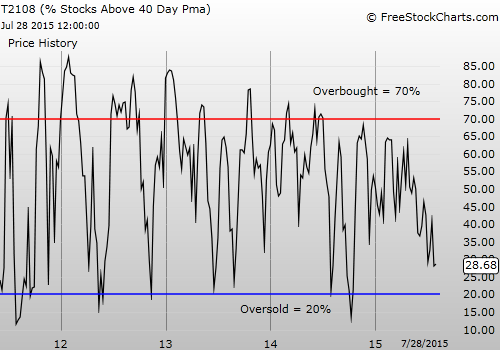
The charts above are the my LATEST updates independent of the date of this given T2108 post.
Be careful out there!
Full disclosure: short AUD/JPY, long AAPL call options

