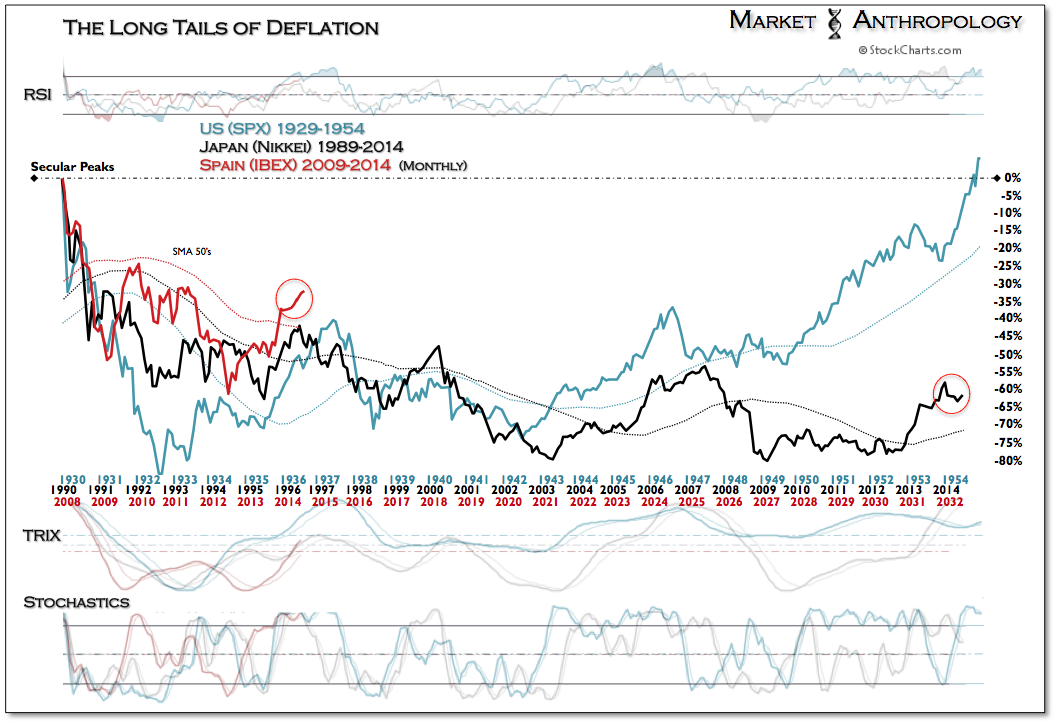
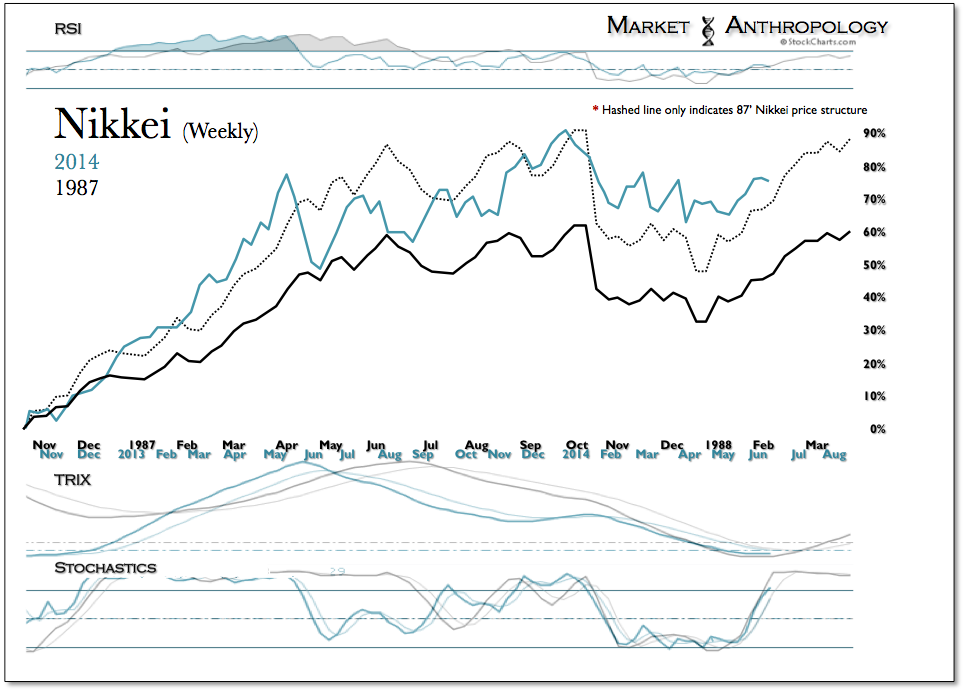
Under the blue skies of the Eisenhower administration - and on the 25th anniversary of its roaring twenties Gatsby high, the made a final turn north and eclipsed the historic 1929 benchmark that had encompassed and defined an entire generation. Previously described in our Long Tail of Deflation, this December will mark the 25th year since the placed the final stones of its equivalent monument. Although both periods experienced prolonged economic contractions that knocked over 80% off their secular valuation peaks, the biggest difference from a historic performance perspective was the US downturn in the early 1930's was brutally acute - and Japan's has been slowly rolling downhill over the past quarter century.
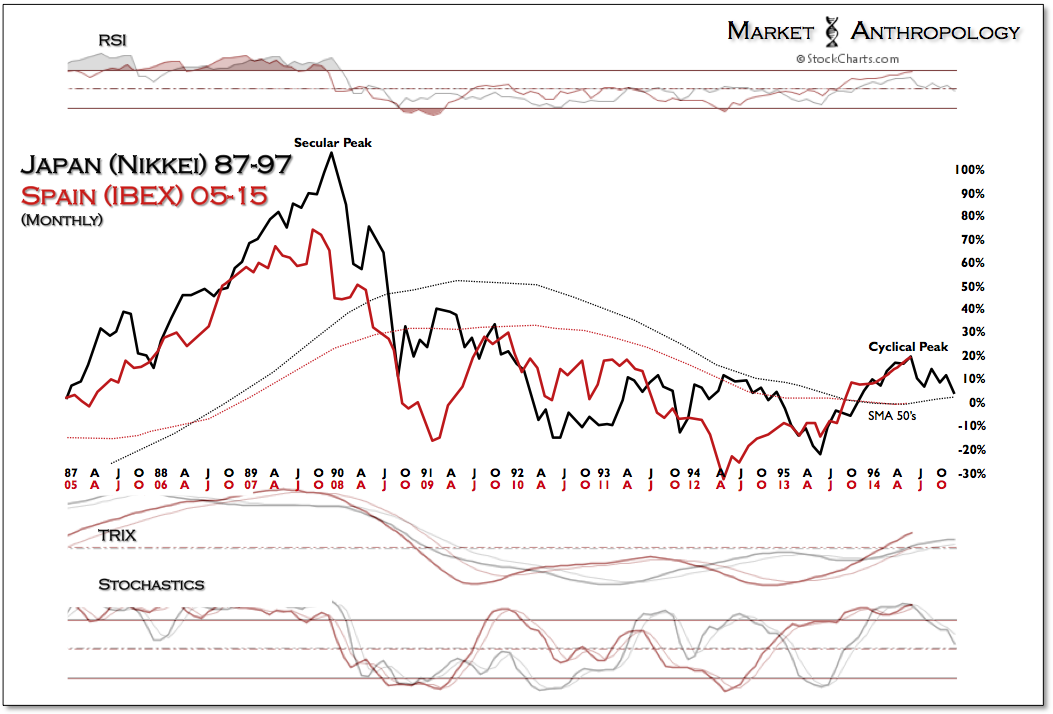
We have kept a close eye on Japan as their grinding capital markets awoke in the back half of 2012 under the bold leadership of a new prime minister bent on delivering the world's third largest economy from the pernicious grip of deflation. While we fully expected the swift retracement that ushered in the new year this January, the magnitude of the decline through May came up a bit short of our estimated target below 14,000. The question now becomes, with the Nikkei failing to break 14,000 once more, has the tide finally turned to allow a major secular breakout as framed by our second chart in the series?
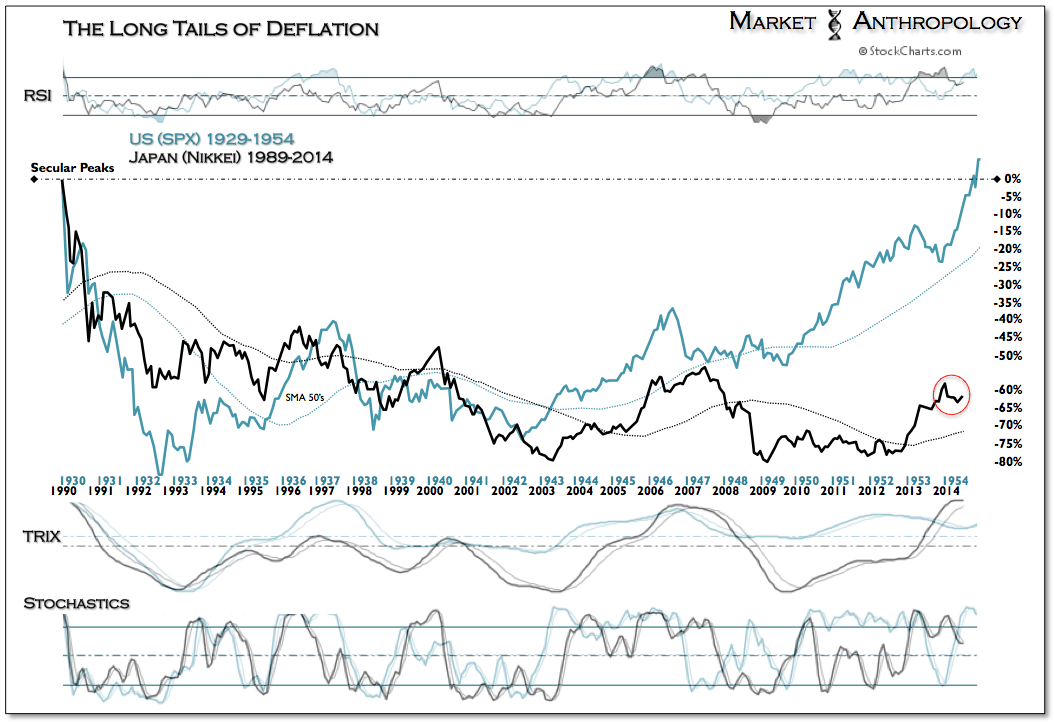
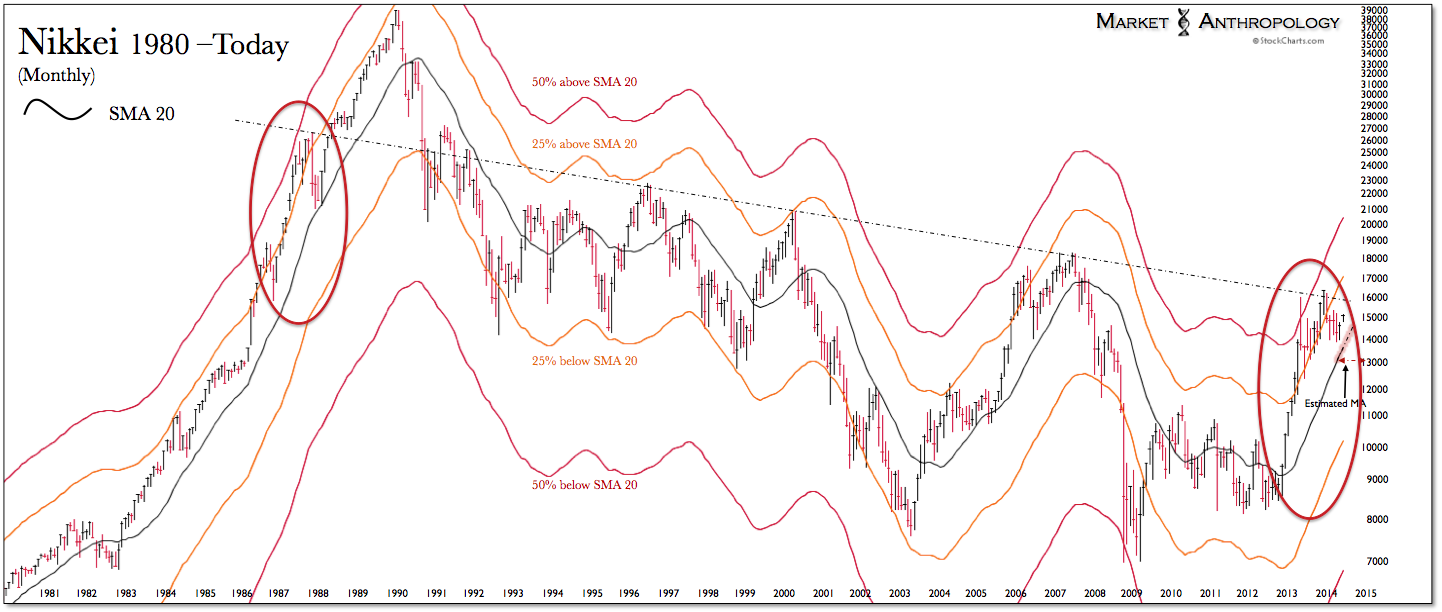
Over the past two decades, it has paid quite well to sell the Nikkei at long-term trend line resistance as shown in the chart below. Coming into this year and throughout Q1 we had expected the Nikkei to retrace back to around its 20 month (sma) moving average, before making another attempt at finally shattering overhead resistance that has caged Japan's equity markets. Although the performance gap is wide in the comparative study between the historic SPX (circa 1954) and the Nikkei today, we feel the prospective breakout in the Nikkei rhymes with the historic trend in the SPX - because of the linear regression bearings of the Nikkei's long-term pattern.
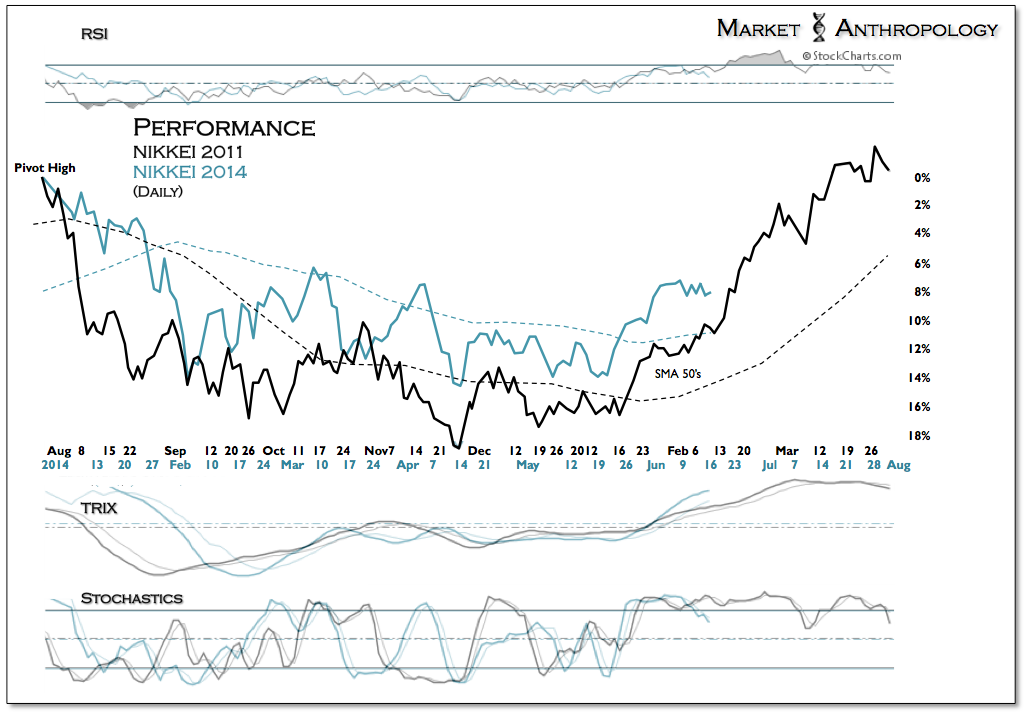
The performance profile that we have followed of the Nikkei's 1987 decline and recovery, places the retracement low in the markets rearview mirror. The 1987 high also marks the topside of the declining trend line resistance, as defined by the chart above.
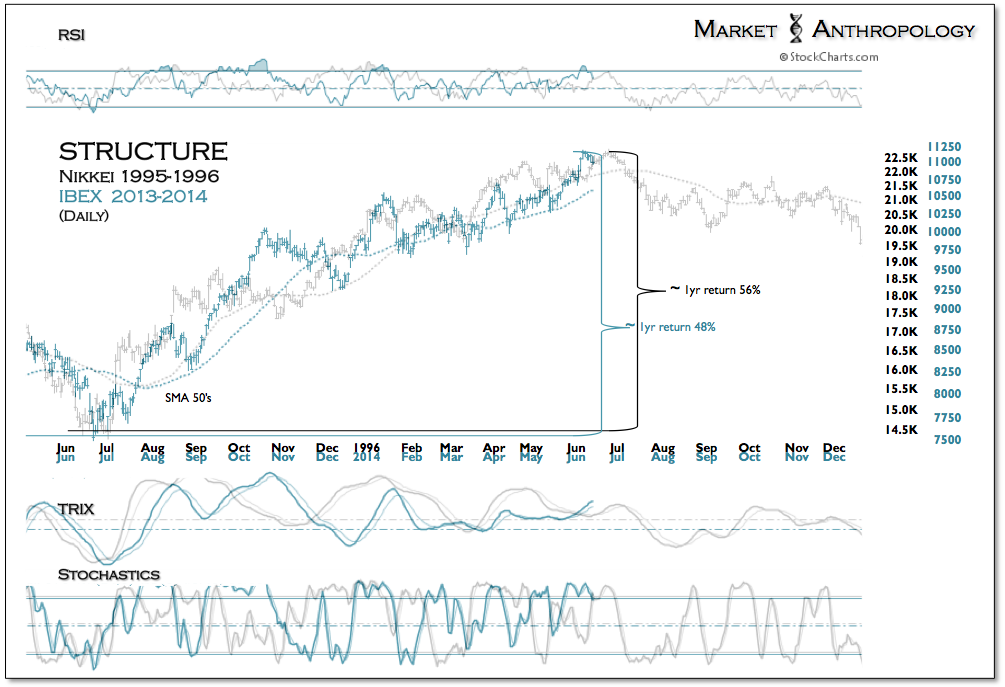
The momentum pattern leading into the retracement was similar to the waterfall decline we had followed closely in the SPX in 2011. This particular set-up was mentioned in
A Quick Word From Your Local Sponsor, and not surprisingly the Nikkei has loosely followed the retracement profile over the past six months.
Should the Nikkei continue to follow the longer-term recovery trend of both historic patterns, the deflationary life sentence commissioned almost 25 years ago would put Japan up for parole this year. Although we suspect the consequence of an ebullient Nikkei to maintain pressures on the yen, the broader macro dynamics witnessed over the past several years with Japan will likely forge different relationships going forward as a new chapter is written.
With Japan languishing in the back eddies of deflation over the past 25 years, it comes as no surprise of what the ECB is attempting to avoid. In a brave new world where central banks are active not just in the throes of a crisis - but in the midst of momentum, it's easy to get swept up in the hope of avoiding such fate. Our general take, however, is it's also easy to conflate causation with policy - as the efficacy of such correlations ebb and flow with a market's given structure, sentiment and positioning. The long and short of which would indicate that time is the great revelator, and although the ECB's actions are received better late than never, the reality is the markets - like water, will gravitate to the path of least resistance in the face of an incoming deflationary tide.
