
Our Adaptive Fibonacci Price Modelling system is suggesting a moderate price peak may be already setting up in the NASDAQ, while the Dow Jones, S&P 500 and Transportation Index continue to rally beyond the projected Fibonacci Price Expansion Levels. This indicates that capital may be shifting away from the already lofty Technology sector and into Basic Materials, Financials, Energy, Consumer Staples, Utilities, as well as other sectors.
This type of a structural market shift indicates a move away from speculation and towards Blue Chip returns. It suggests traders and investors are expecting the U.S. consumer to come back strong (or at least hold up the market at least) over the next 6+ months.
Shifting Market Sectors Could Catch Traders Off Guard
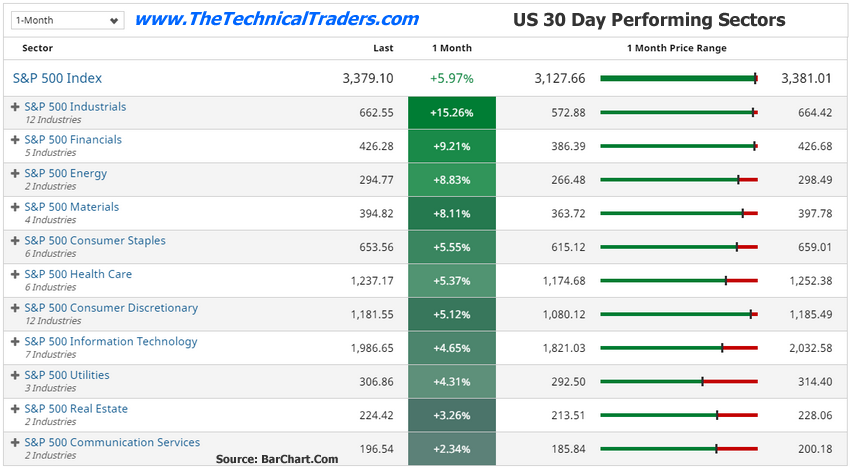
Recently, a moderately large shift away from Technology and Biotech has taken place where traders and investors have started to move capital away from these high-flying sectors and into more traditional market sectors like the Industrials, Financials, Energy, Materials amongst others. This type of shift takes place when traders and investors believe a consumer-based economy will dominate essential components within the markets and when technology or price speculation has driven stock price levels to near extreme levels. Take a look below for a list of the top-performing sectors over the last 30 days.
We like to think of these things in terms of simple supply and demand. When price levels reach extreme highs and buyers no longer believe the valuation levels to be accurate (or overvalued), then buying activity slows or stops. Buyers will start to seek our other assets that appear to be undervalued as there is a greater chance to profit from those assets.
It appears that traders are now shifting into consumer staples, energy, materials, and financials, expecting market support for the remainder of 2020 to come from the things that people cannot live without. This could mean the high flying NASDAQ and Bio-Tech sector may be left wanting for the next 4+ months or longer.
Fibonacci Price Ranges Suggest A Peak May Be Near
Our proprietary Fibonacci Price Modeling system assists us in learning where and when price levels have reached critical turning points and nearing exhaustion points. The NASDAQ Daily chart below highlights our Fibonacci Price Modelling system. It shows a YELLOW Rectangle that spans the range of the upside Fibonacci projected price expansion level from the lows in late June 2020. Notice how price rallied above the 10,600 price level in mid-July, then began to weaken and rotate between 10,600 and 11,300. The projected Fibonacci Price Expansion levels suggested price would attempt to move into this range as the main resistance area. Of course, price could continue to rally beyond these ranges in strong momentum – which we've seen in the past.
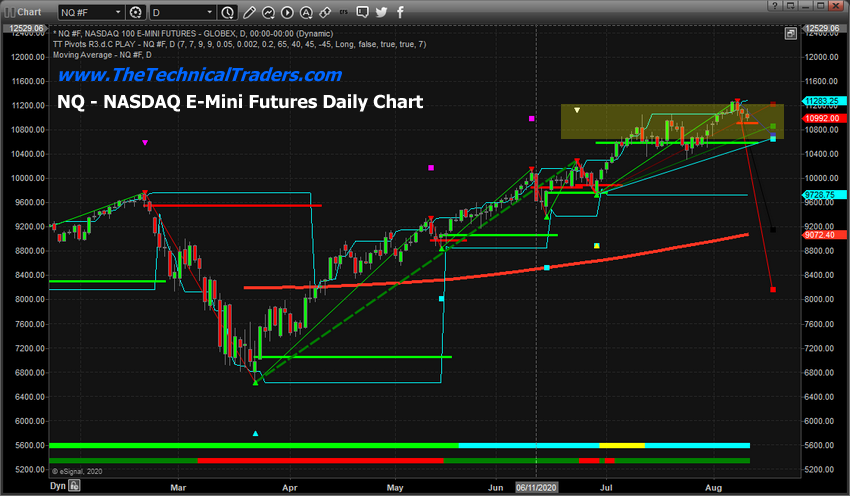
If the shift in capital away from the NASDAQ pushes price levels below 10,915 on a closing price basis, then the daily chart will confirm a new potential bearish price trend in the NASDAQ, which could see price levels falling to 10,650, 9,175, or 8,190. Each of these lower Fibonacci price expansion levels are adapted to the current range of price rotation (peaks and troughs) setup over the past 280+ days. Thus, our Fibonacci Price Modelling system attempts to adapt to price ranges and rotation in a way that presents very real trigger levels and targets for future price activity.
This next chart, the Transportation Index Daily chart, also suggests that price levels have already breached the Fibonacci Projected Price Expansion levels. As such, the Transportation Index may have already breached key resistance – pushing into a Scouting Pattern type of price formation. This is where price attempts to “scout out” a price area that is somewhat “alien” to normal price ranges. If strong support if found above this resistance level, then prices will hold above the resistance level and attempt to move higher. If support is not found in the scouting area, then price will almost immediately fall back into the resistance area and consolidate or initiate a new downside price trend.
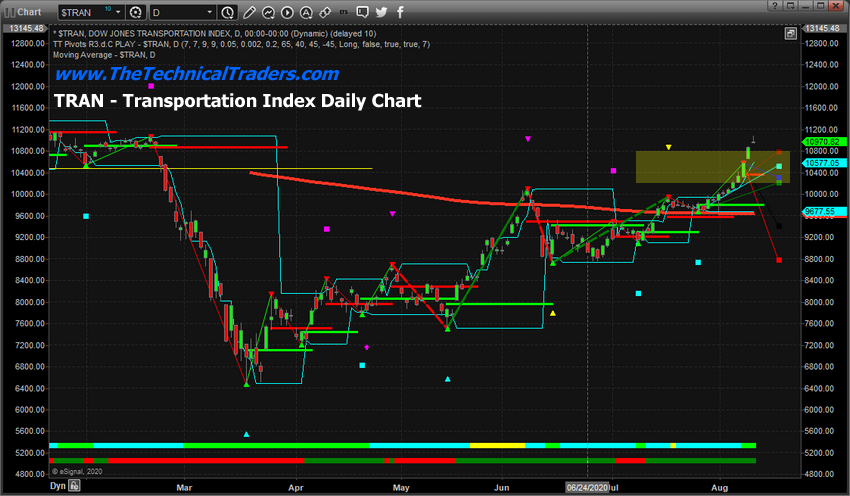
The YELLOW Rectangle area on the chart above highlights the Fibonacci Price Expansion levels presented by the Fibonacci Price Modelling system. Any rally beyond these projected expansion levels would suggest a massive shift in capital is taking place where price momentum, traders piling into the shifting trading environment, are driving price activity well beyond normal Fibonacci price expansion ranges.
Moving Averages Also Suggest A Peak
As you can see from the chart below, the number of stocks above the 50-period Moving Average (MA) level has climbed to 87.49. In layman terms, this means that nearly 90% of all stocks (within the Dow Comp) are above their 50-period MA is near extremely high levels.
Historically, when this indicator reaches above 85~90, price peaks usually set up within 5 to 7+ trading days prompting a downside price trend that may last 10 to 30+ days.
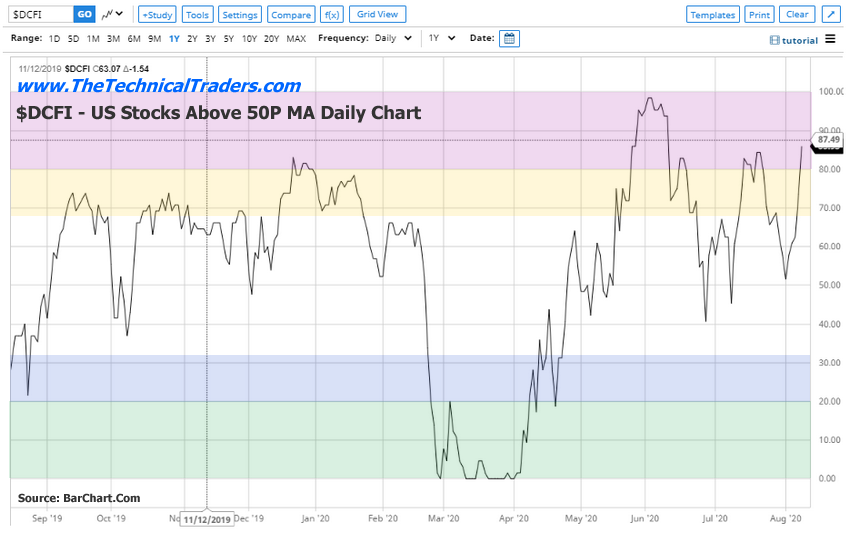
Additionally, over the past 12+ months, we can see that the current level of this indicator is near the highest levels reached at any other time over the past 12+ months. This suggests that the U.S. stock market has currently reached overbought levels that are moderately extreme. We would expect this indicator to rotate lower, possibly reaching levels near 35 to 45 from these current peak levels.
Recently, we published a research article that suggested the SPY and TRAN (Transportation Index) appear to have another 2 to 4% (or more) to the upside before reaching a full 100% measured move. After the past two days of strong upside price activity, we believe we are nearing a peak in price levels and urge traders to take precautions – protect open long positions.
The NASDAQ appears to be much weaker than the Dow Jones or S&P 500 right now – yet all of these U.S. major indexes appear to be nearing a peak level. The breakdown of gold and silver today suggest that metals may have moved beyond critical support on panic buying. A similar type of downside price move could take place in the U.S. major indexes if traders suddenly realize price levels have been pushed “too far to the upside” ... particularly in the NASDAQ.