AT40 = 59.4% of stocks are trading above their respective 40-day moving averages (DMAs)
AT200 = 59.9% of stocks are trading above their respective 200DMAs
VIX = 9.4
Short-term Trading Call: cautiously bullish
Commentary
The market fatigue I pointed out last week lasted just one more day. In the spirit of this relentless bull market, the dip was ever so shallow and ever so brief. Moreover, it was just enough of a pause to refresh the buying spirit of traders and investors. The S&P 500 (SPDR S&P 500 (NYSE:SPY)), NASDAQ, and the PowerShares QQQ ETF (NASDAQ:QQQ) all benefited with new all-time highs.
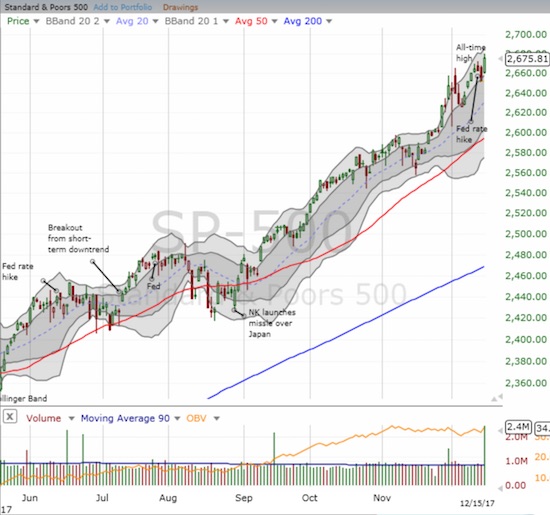
The S&P 500 (SPY) jumped to another all-time high on extremely high volume.
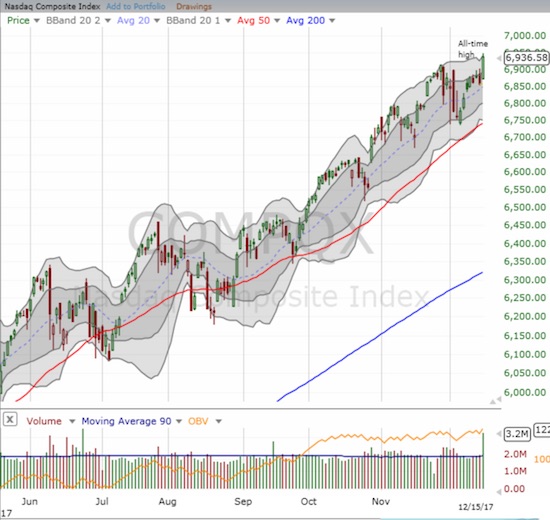
The NASDAQ jumped to another all-time high on extremely high volume.
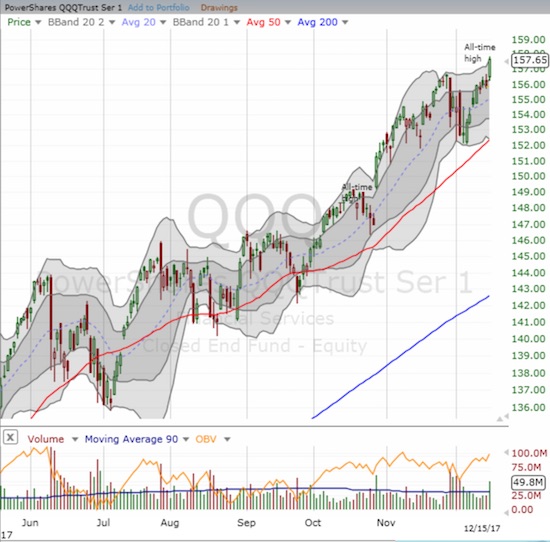
The PowerShares QQQ ETF (QQQ) finished invalidating the swoon from 2-3 weeks ago. Volume also jumped although it has been higher in recent months.
AT40 (T2108), the percentage of stocks trading above their respective 40-day moving averages (DMAs), affirmed the swift switch back to bullish affinities with a surge from 51.2% to 59.5%. AT40 rallied to as high as 62.6%. The volatility index, the VIX, added its confirmation by plunging 10.2% to 9.4. For reference, recall that the VIX hit an all-time closing low of 9.1 on November 3, 2017. I promptly doubled down on my call options on ProShares Ultra VIX Short-Term Futures (NYSE:UVXY) for what I now think is an important hedge even if the periodic VIX surge is not actually around the corner.
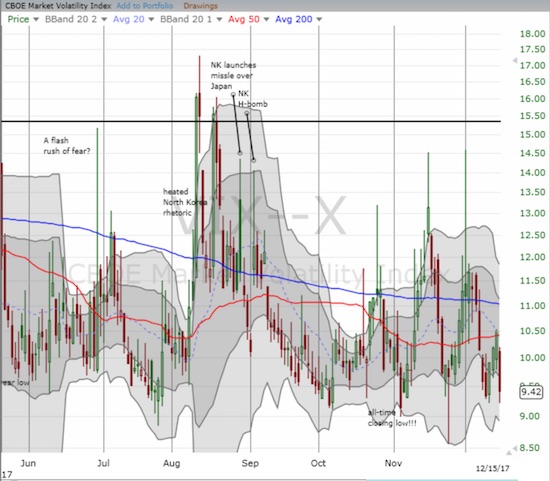
The volatility index, the VIX, is starting to get very familiar with historically low levels.
I left my short-term trading call at cautiously bullish. I still want to see buyers push AT40 into overbought conditions before before getting fully on board. Until then, the market’s lack of breadth keeps me a bit wary.
The Perfect Bubble
Bitcoin and cryptocurrencies are all the rage now. Having lived through two massive financial bubbles, I have promised myself to stay out of this frenzy (or mostly anyway, until a friend drags me kicking and screaming into one of these 109, yes ONE HUNDRED AND NINE AND COUNTING, newfangled coins). Yet, I cannot help enjoying some of the commentary. The tweet below from Nassim Taleb of “Black Swan” fame, and the subsequent responses, helps reveal why and how fans of Bitcoin and other cryptocurrencies have helped to create the “perfect” bubble.
I also checked in on Google (NASDAQ:GOOGL) Trends for Bitcoin. I was astonished to discover that search trends on Bitcoin are still running at all-time highs – a true testimony to the power of the frenzy.
STOCK CHART REVIEWS
InterXion Holding N.V. (NYSE:INXN)
While I am still bullish on Europe, I decided to sell my holdings in INXN. It was a great run and a very profitable application of SwingTradeBot.
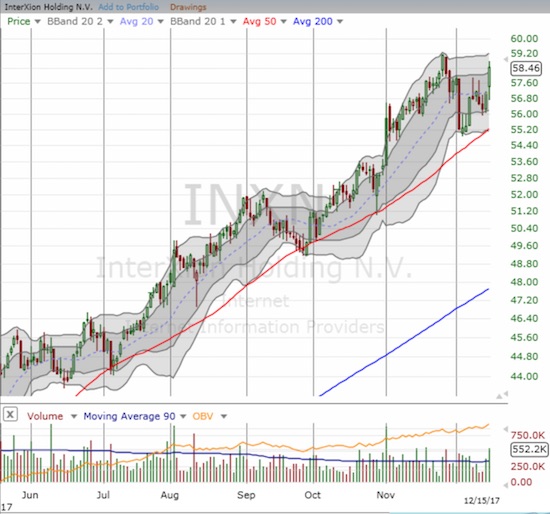
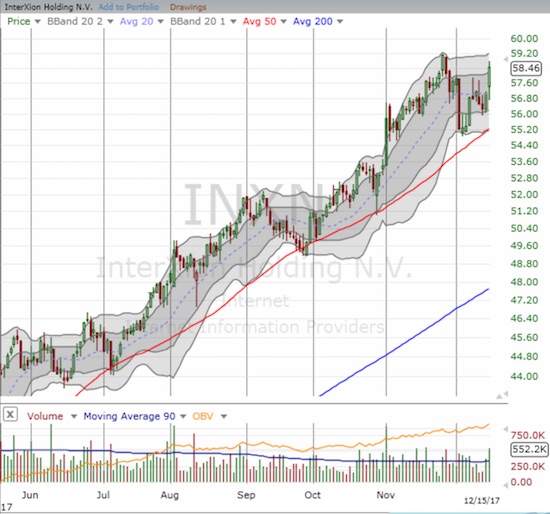
InterXion Holding N.V. (INXN) recently bounced away from a 50DMA test as the stock preserved its impressive uptrend.
Costco (NASDAQ:COST)
Add COST to the growing list of retailers sailing past previous Amazon (NASDAQ:AMZN) Panics. COST hit a fresh all-time high last week thanks to a strong post-earnings performance. Interestingly, I only found ONE direct reference to Amazon in the transcript from the earnings conference call.
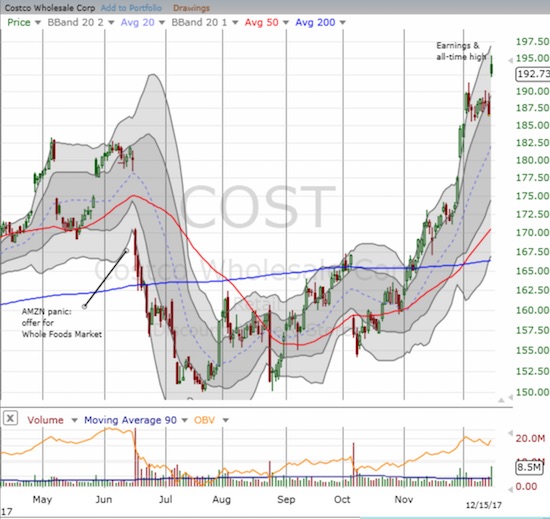
Costco Wholesale Group (NASDAQ:COST) finished reversing its Amazon panic at the end of November. Now the stock is back to its long-standing uptrend.
Okta (OKTA)
Retailers are sailing past Amazon Panic, but the panic can still exact damage. Authentication platform OKTA was recently rocked on the notion that Amazon Web Services (AWS) and its single sign-on solution will displace services like OKTA. I have OKTA on my short buy list even with the 50DMA breakdown.
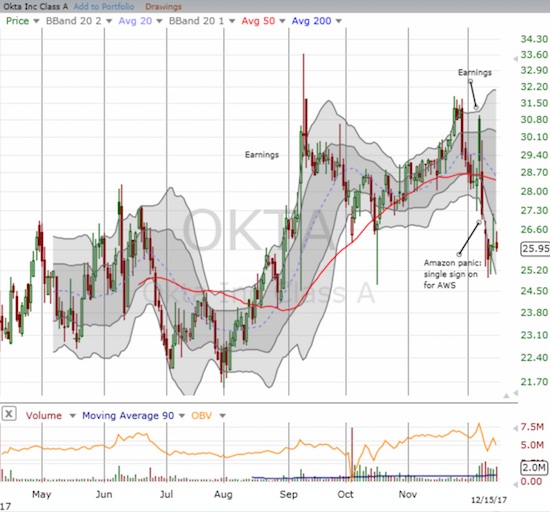
Okta (OKTA) has experienced two very wild and wide-swinging post-earnings reactions. A recent Amazon Panic added more overhang to the stock, but the move may represent a buying opportunity as most other Amazon Panics have done.
Lending Club (NYSE:LC)
Almost a year and a half ago, I drew up LC as a potential play on a bottom. While that trade is long over, I post an updated chart given the stock has once again collapsed…this time from a very extended consolidation period where the stock traded in a wide range. Starting with a big breakdown in November, LC further swooned on December 7th to test the May, 2016 lows. I am not nearly as optimistic this time around that the low will hold. I am just watching for now. I cannot help but wonder whether this pear-to-peer lending model will ultimately survive. Maybe its time for a cryptocurrency-enabled lending platform…?
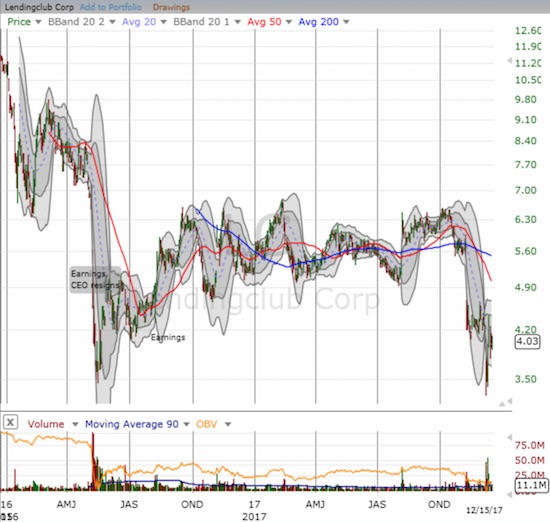
The LendingClub Corporation (LC) is reeling again. Can last year’s all-time low hold?
“Above the 40” uses the percentage of stocks trading above their respective 40-day moving averages (DMAs) to assess the technical health of the stock market and to identify extremes in market sentiment that are likely to reverse. Abbreviated as AT40, Above the 40 is an alternative label for “T2108” which was created by Worden. Learn more about T2108 on my T2108 Resource Page. AT200, or T2107, measures the percentage of stocks trading above their respective 200DMAs.
Active AT40 (T2108) periods: Day #456 over 20%, Day #270 over 30%, Day #70 over 40%, Day #18 over 50%, Day #9 under 60% (underperiod), Day #44 under 70%
Daily AT40 (T2108)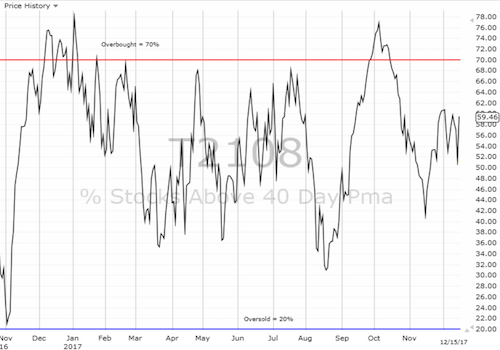
Black line: AT40 (T2108) (% measured on the right)
Red line: Overbought threshold (70%); Blue line: Oversold threshold (20%)
Weekly AT40 (T2108)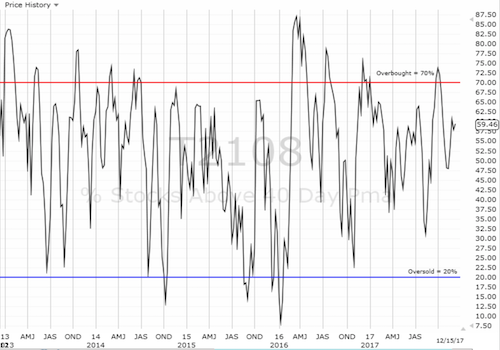
*All charts created using freestockcharts.com unless otherwise stated
The charts above are my LATEST updates independent of the date of this given AT40 post.
Be careful out there!
Full disclosure: long UVXY calls
