As storm clouds have dissipated and flood waters recede, Houstonians are already beginning the process of rebuilding. While emergency crews remain and shelters brim with the displaced, a feeling of “hope” fills the atmosphere. It is an amazing thing to hear that shelters and volunteer centers are having to “turn away” those wanting TO help simply because there are “too many.” Or, to see the millions of dollars raised in just hours to make sure those impacted by the storm are assisted.
It is truly a testament to the nature of us all. While the media has made it seem as if America has devolved into a “civil war,” the rally of the nation to aid those in need shows it is clearly not. There is “hope.”
Personally, as well as the rest of us at Real Investment Advice, want to thank everyone for all of the kind words, emails, and prayers that flooded our inbox over the past week. The outpouring was more than we could have imagined. Thank you.
As I wrote this past Tuesday, we were lucky. Thousands who live along the Texas coastline were not.
I am thankful. I am grateful. I am hopeful.
The return to “normalcy,” for most of us, will take some time. It will happen. Let’s just try and remember this fellowship and hang onto it for a while longer.
Review and Update
Speaking of a return to “normalcy,” it didn’t take long for the markets to overlook the disaster from “Hurricane Harvey,” and begin rationalizing why this is yet another “support” for the continuing “bull market.”
In last week’s missive, I laid out two “scenarios” for the market, via the S&P 500, as noted below:
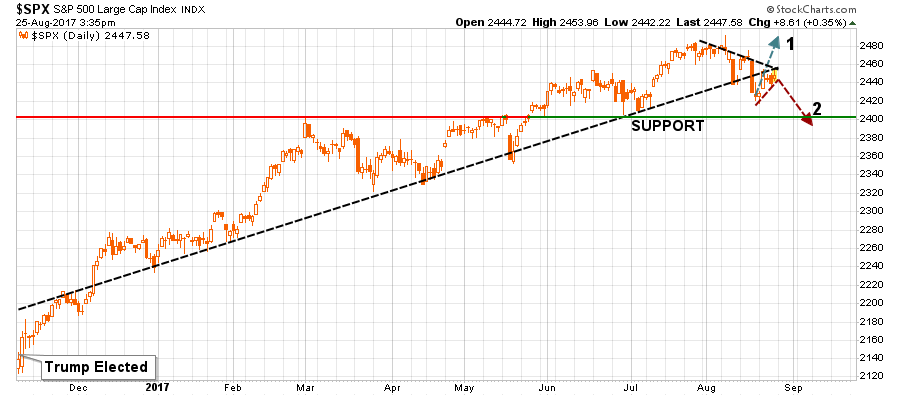
Scenario 1:
The market regains its footing next week and rallies strongly enough to break above the downward trending levels of previous rally attempts. Such action would confirm the bullish trend remains intact and would provide the opportunity to rebalance equity exposure to model weights accordingly.
Scenario 2:
The market rallies to the upwardly sloping “bullish trend line” that began with the election of President Trump. The rally fails at resistance and turns lower. Such a failure would confirm the current short-term bullish trend has likely concluded leading to a reduction of equity exposure, increases in cash positions and fixed income, and a reduction in overall portfolio equity risk.
While it looked like “scenario 2” was going to play out early last week, that was reversed as the markets started to bet on the optics of a stimulus fueled boost to the economy.
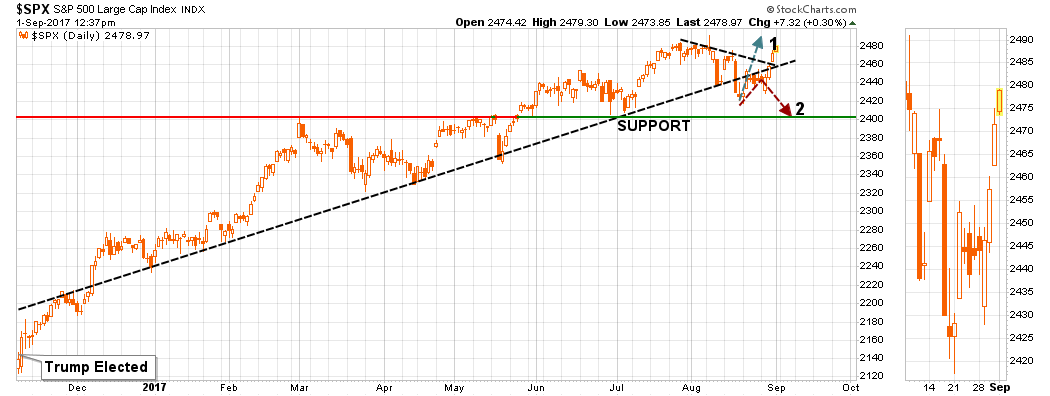
(I have a sneaky suspicion that when I update the Fed Balance Sheet reinvestment analysis next week, shown below, we are going to find a substantial, well-timed, reinvestment by the Central Bank. Wanna bet?)
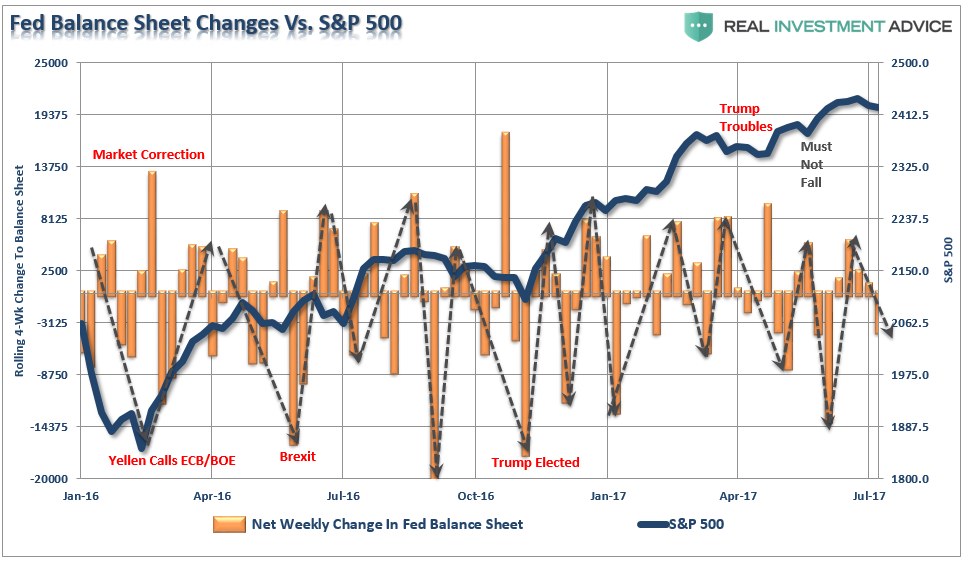
Regardless, the market broke back above its 50-dma and cleared the recent downtrend to re-confirm the bullish bias. Furthermore, the reversal of the short-term “sell signal” also provides a tailwind for investors currently which suggests that markets should be able to reach all-time highs before the next corrective action begins.
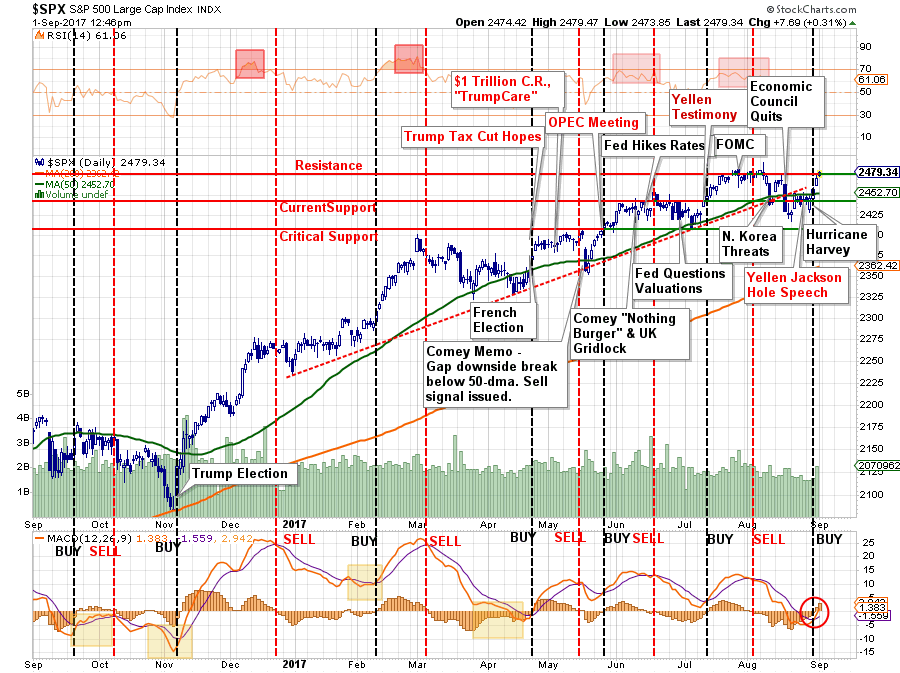
Importantly, the bullish trend remains intact thereby keeping portfolios allocated toward equity risk. This “return to normalcy” is occurring within the context of a very short-term view. With valuations extended, economic data weak and exuberance elevated, this is not a time to ignore the rising longer-term risks to overly aggressive portfolio allocations.
The Rule Of 20
It is this longer-term view I want to focus on for today.
Bryon Wien recently asked the question of where we are in terms of the economy and the market to a group of high-end investors. To wit:
“The one issue that dominated the discussion at all four of the lunches was whether or not we were in the late stages of the business cycle as well as the bull market. This recovery began in June 2009 and the bull market began in March of that year. So we are more than 100 months into the period of equity appreciation and close to that in terms of economic expansion.“
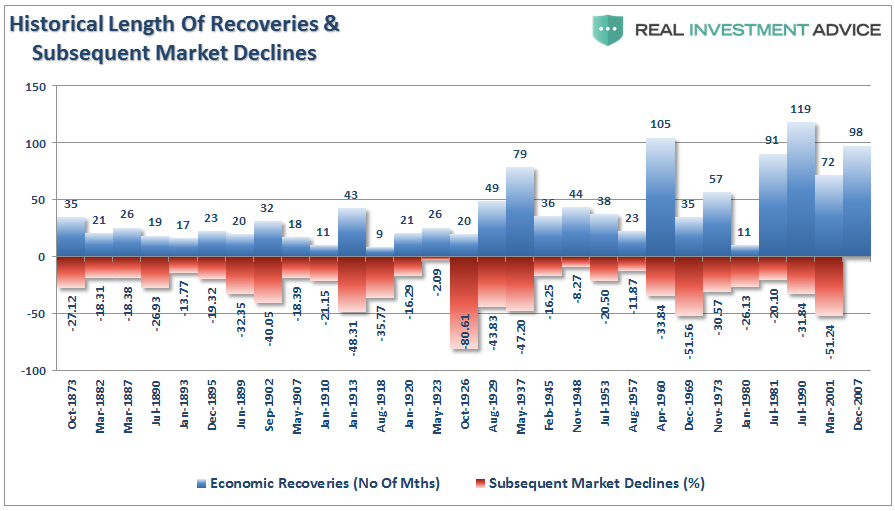
Importantly, it is not just the length of the market and economic expansion that is important to consider. As I explained just recently, the “full market cycle” will complete itself in due time to the detriment of those who fail to heed history, valuations, and psychology.
“There are two halves of every market cycle. “
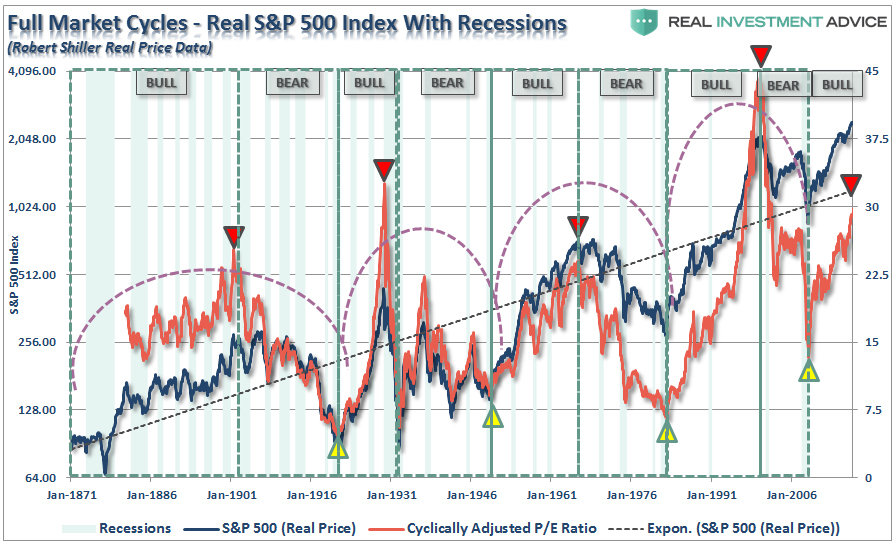
“In the end, it does not matter IF you are ‘bullish’ or ‘bearish.’ The reality is that both ‘bulls’ and ‘bears’ are owned by the ‘broken clock’ syndrome during the full-market cycle. However, what is grossly important in achieving long-term investment success is not necessarily being ‘right’ during the first half of the cycle, but by not being ‘wrong’ during the second half.
Will valuations currently pushing the 3rd highest level in history, it is only a function of time before the second-half of the full-market cycle ensues.
That is not a prediction of a crash.
It is just a fact.”
As Wien states, Howard Marks, via Oaktree Capital Management, and arguably one of the most insightful thinkers on Wall Street recently penned a piece discussing the risk to investors. I suggest you read the whole piece, but here is the relevant passage:
“Today’s financial market conditions are easily summed up: There’s a global glut of liquidity, minimal interest in traditional investments, little apparent concern about risk, and skimpy prospective returns everywhere. Thus, as the price for accessing returns that are potentially adequate (but lower than those promised in the past), investors are readily accepting significant risk in the form of heightened leverage, untested derivatives and weak deal structures. The current cycle isn’t unusual in its form, only its extent. There’s little mystery about the ultimate outcome, in my opinion, but at this point in the cycle it’s the optimists who look best.”
Unfortunately, that was also a repeat of a passage he wrote in February 2007.
In other words, while things may seemingly be different this time around, they are most assuredly the same.
This brings us to the “Rule of 20.” The rule is simply inflation plus valuation and should be “no more than 20.” Interestingly, while the rule is pushing the 3rd highest level in history, only behind 1929 and 2000, Mr. Wien states that such levels only suggest the market is “fully priced” rather than “egregiously overvalued.” Regardless of what definition you choose to use, the math suggests forward 10-year returns will be substantially lower than the last.
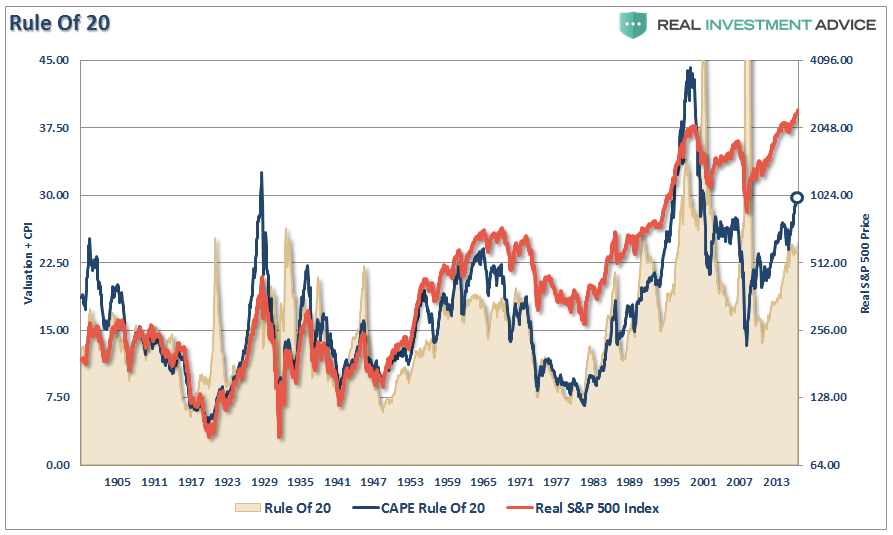
In a market where momentum is driving an ever smaller group of participants, fundamentals are displaced by emotional biases. Such is the nature of market cycles and one of the primary ingredients necessary to create the proper environment for an eventual crash.
Notice, I said eventually.
I do agree the markets are indeed currently bullish and therefore, as stated above, portfolios remain tilted towards equities currently. However, just because fundamentals are currently ignored by “greed” and “momentum,” does not mean such will always be the case.
As David Einhorn once stated:
“The bulls explain that traditional valuation metrics no longer apply to certain stocks. The longs are confident that everyone else who holds these stocks understands the dynamic and won’t sell either. With holders reluctant to sell, the stocks can only go up – seemingly to infinity and beyond. We have seen this before.
There was no catalyst that we know of that burst the dot-com bubble in March 2000, and we don’t have a particular catalyst in mind here. That said, the top will be the top, and it’s hard to predict when it will happen.”
Is this time different?
Probably not.
The Risk To Passive
The other potential danger noted by Wien was ETF’s (Exchange Traded Funds). To wit:
“One other potential danger that investors seem too complacent about is Exchange Traded Funds. While most know these instruments as a great convenience in getting or reducing exposure to sectors or asset classes, they may prove to be less liquid than their participants believe and could destabilize the financial markets.”
But most importantly:
“Most owners of ETFs don’t know what’s in them. What happens when everyone wants to get out at the same time?”
As I noted in “Rise Of The Robots”:
“At some point, that reversion process will take hold. It is then investor “psychology” will collide with “margin debt” and ETF liquidity. As I noted in my podcast with Peak Prosperity:
‘It will be the equivalent of striking a match, lighting a stick of dynamite and throwing it into a tanker full of gasoline.’
When the ‘robot trading algorithms’ begin to reverse, it will not be a slow and methodical process but rather a stampede with little regard to price, valuation or fundamental measures as the exit will become very narrow.
Importantly, as prices decline it will trigger margin calls which will induce more indiscriminate selling. The forced redemption cycle will cause catastrophic spreads between the current bid and ask pricing for ETF’s. As investors are forced to dump positions to meet margin calls, the lack of buyers will form a vacuum causing rapid price declines which leave investors helpless on the sidelines watching years of capital appreciation vanish in moments.
If you don’t believe…just go look at what happened on September 15th, 2008.
It happened then.
It will happen again.”
While investors insist the markets are currently NOT in a bubble, it would be wise to remember the same belief was held in 1999 and 2007. Throughout history, financial bubbles have only been recognized in hindsight when their existence becomes “apparently obvious” to everyone. Of course, by that point, it was far too late to be of any use to investors and the subsequent destruction of invested capital.
This time will not be different. Only the catalyst, magnitude, and duration will be.
Investors would do well to remember the words of the then-chairman of the Securities and Exchange Commission Arthur Levitt in a 1998 speech entitled “The Numbers Game:”
“While the temptations are great, and the pressures strong, illusions in numbers are only that—ephemeral, and ultimately self-destructive.”
But it was Howard Marks which summed up our philosophy on “risk management” well when he stated:
“If you refuse to fall into line in carefree markets like today’s, it’s likely that, for a while, you’ll (a) lag in terms of return and (b) look like an old fogey. But neither of those is much of a price to pay if it means keeping your head (and capital) when others eventually lose theirs. In my experience, times of laxness have always been followed eventually by corrections in which penalties are imposed. It may not happen this time, but I’ll take that risk.”
I will receive a lot of emails from this article trying to pose counter-arguments, explain to me why this time is different, or that I am missing out.
I am okay with that.
Client’s don’t pay a fee to chase markets. They pay a fee to employ an investment discipline, trading rules, portfolio hedges and management practices that have been proven to reduce the probability a serious and irreparable impairment to their hard earned savings.
Unfortunately, the rules are REALLY hard to follow. If they were easy, then everyone would be wealthy from investing. They aren’t because investing without a discipline and strategy has horrid consequences.
So, what’s your plan for the second-half of the full market cycle?
See you next week.
Market and Sector Analysis
Data Analysis of the Market and Sectors for Traders
S&P 500 Tear Sheet
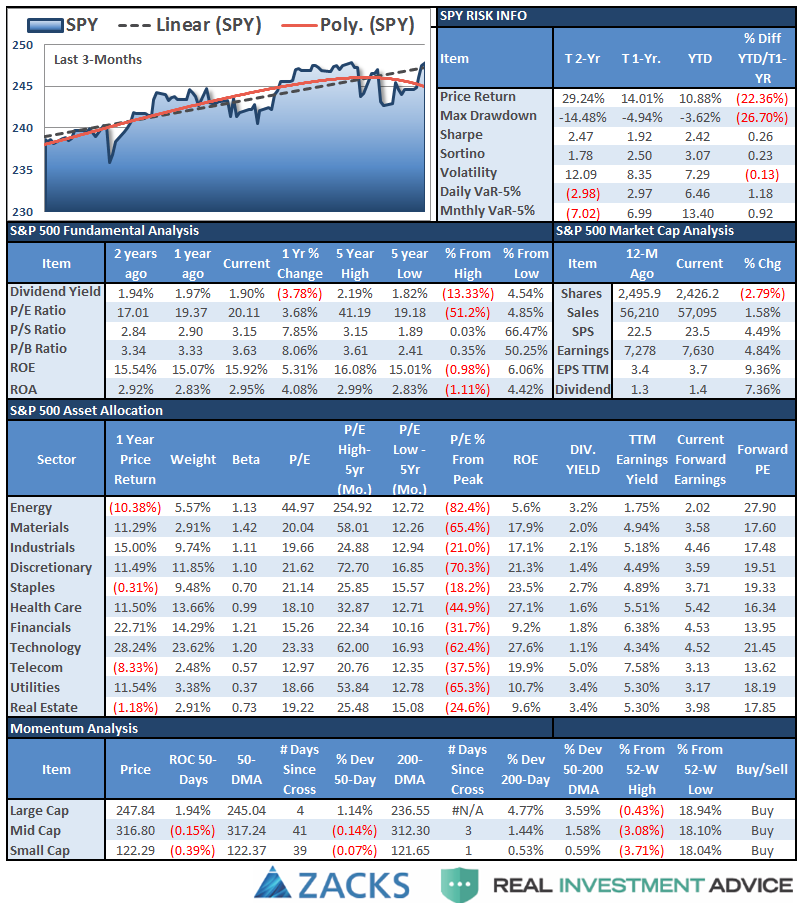
Performance Analysis
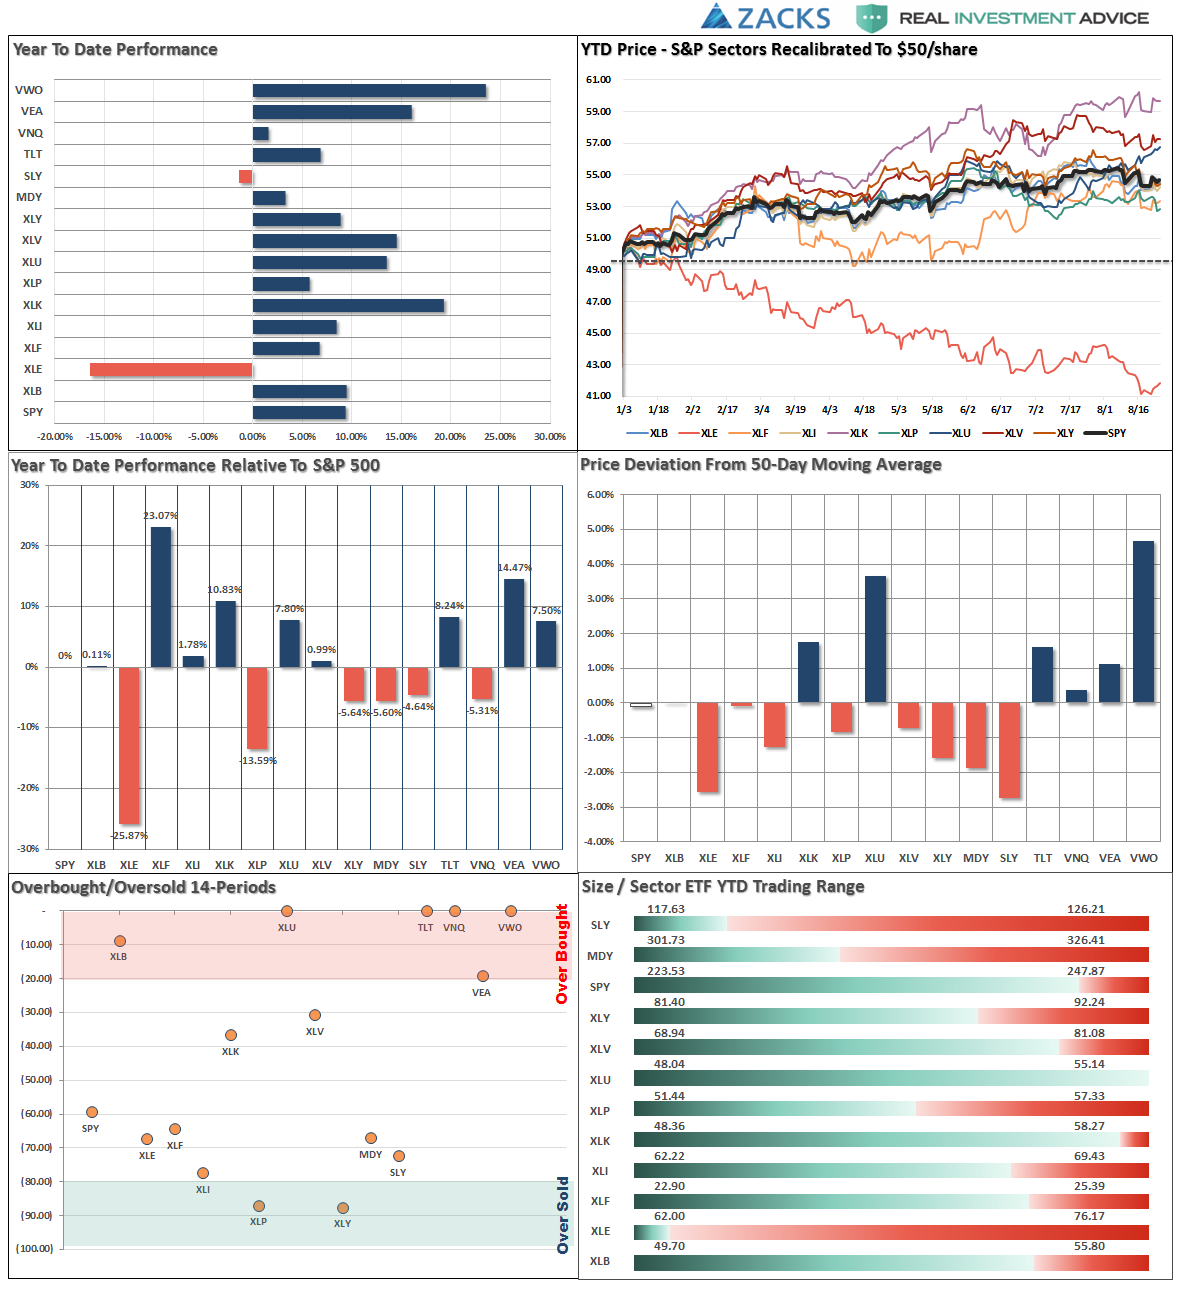
ETF Model Relative Performance Analysis
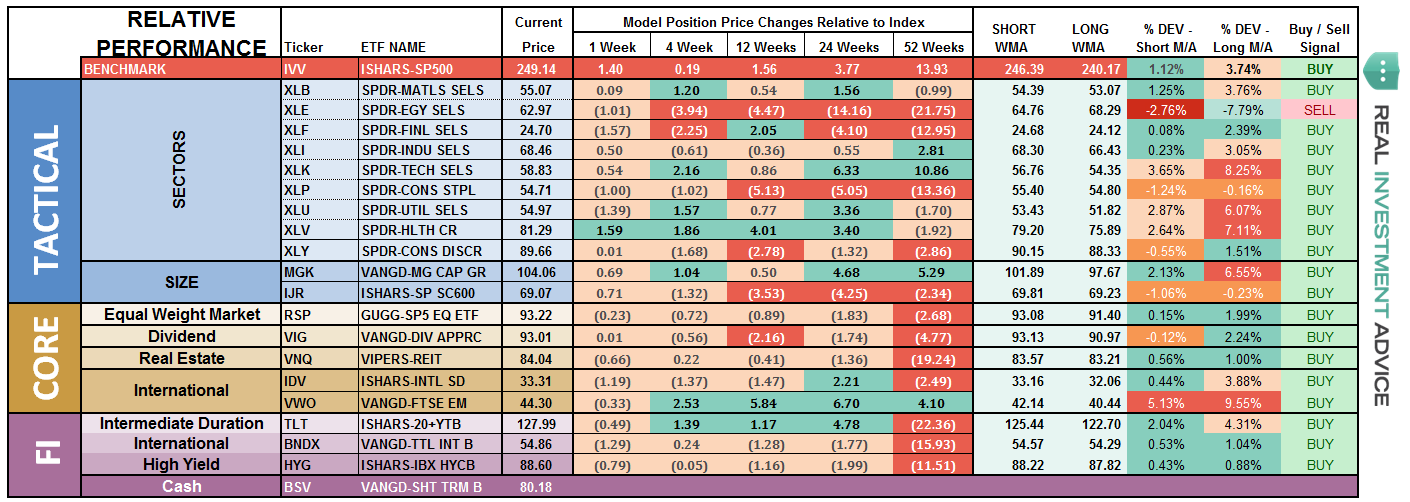
Sector and Market Analysis:
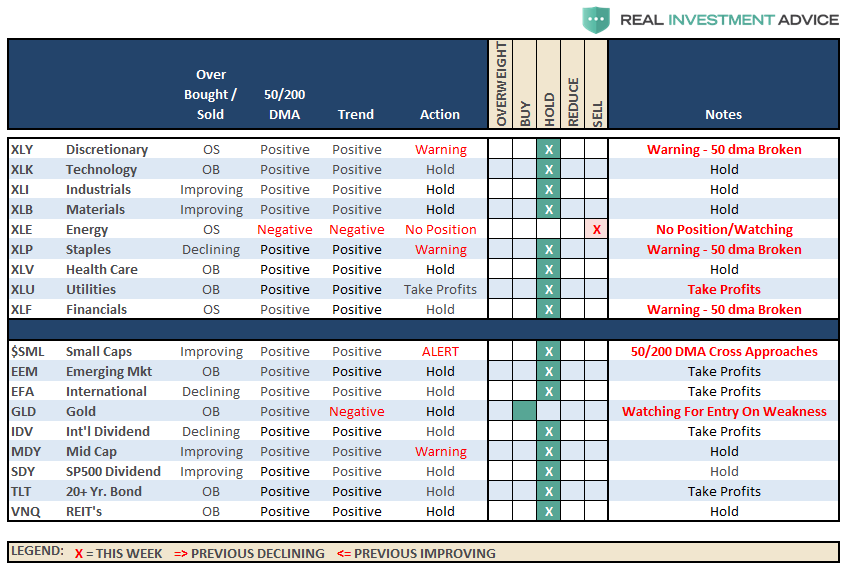
While a recovery effort was underway in Houston, the markets staged their own recovery this past week surging higher and breaking above both the current short-term downtrend and reclaiming the 50-dma. Let’s take a look at the sector breakdown.
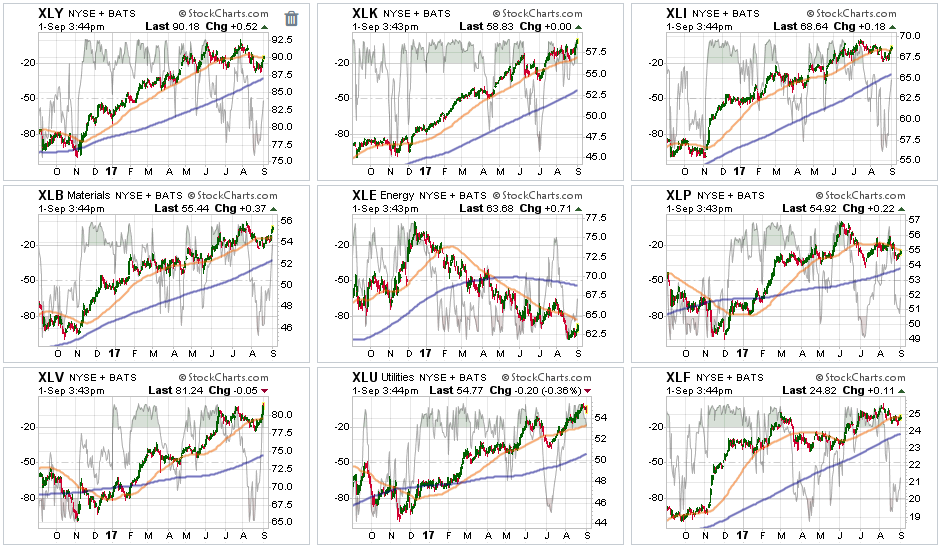
Technology, Discretionary, Industrials, Materials, and Health Care were the best performers this past week relative to the S&P 500 index as the “risk-off” trade came out of Utilities and back into the “risk-on” trade. Since these sectors are some of the largest weightings in the S&P, it propelled the market back onto a more bullish stance.
Financials, Utilities, and Staples were weaker on a relative basis but bullish trends remain intact for now.
Energy finally mustered a decent bounce in the sector, but the trends and backdrop remain sorely negative. Oil prices remain weak and there is little that suggests the damage is over yet. It is advised to continue using bounces in energy as a means to reduce exposure to the sector. We continue to remain out of the sector entirely.
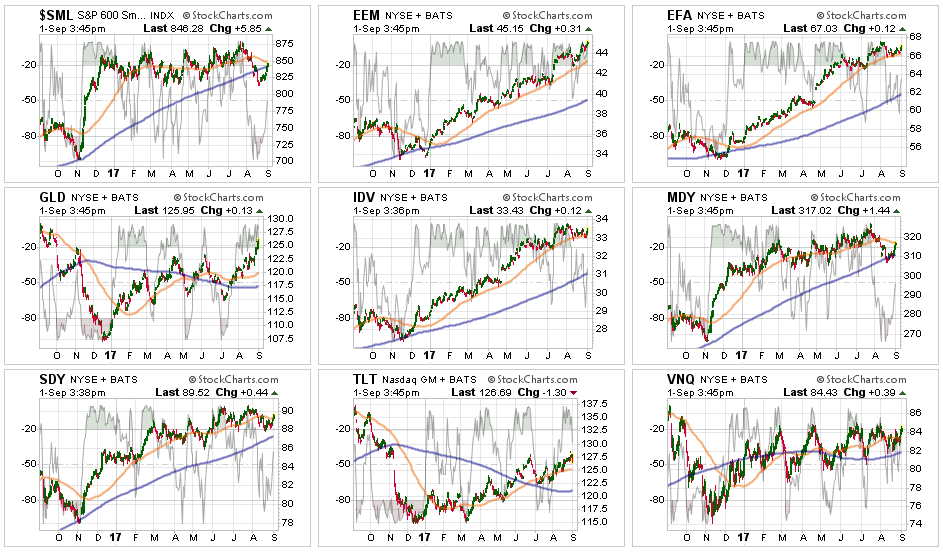
Small and Mid-Cap stocks got a strong bounce this past week, but keep a watch on both these indices as the 50-dma poses resistance and each has turned lower.
Emerging Markets and International Stocks continue to hold support and money has been chasing performance in these sectors as of late. Continue to hold positions for now.
Gold – FINALLY was able to break out of its trading range last week and its longer-term downtrend. With gold once again very overbought, we will begin looking for an entry point on any weakness which does not reverse the recent breakout.
S&P Dividend Stocks (IDV and SDY), after adding some additional exposure recently we are holding our positions for now with stops moved up to recent lows. The index climbed back above its 50-dma and is reversing its oversold condition. We added to this position this past week.
Bonds and REITs continued to perform well last week as money rotated from “risk” into “safety.” Holding current positions for now.
Sector Recommendations:
The table below shows thoughts on specific actions related to the current market environment.
(These are not recommendations or solicitations to take any action. This is for informational purposes only related to market extremes and contrarian positioning within portfolios. Use at your own risk and peril.)
Portfolio Update:
As noted above, the overall bullish trend remains positive which keeps our portfolios allocated toward equity risk. However, we continue to watch the deterioration of the primary supports of the market which remain concerning. But the trend remains the trend for now, and the recovery of the market above the 50-dma allowed us to allocate some capital in newer accounts to equity related risk.
We remain extremely vigilant of the risk that we are undertaking by chasing markets at such extended levels, but our job is to make money as opportunities present themselves. Importantly, stops have been raised to trailing support levels and we continue to look for ways to “de-risk” portfolios at this late stage of a bull market advance.
Again, we remain invested but are becoming highly concerned about the underlying risk.
