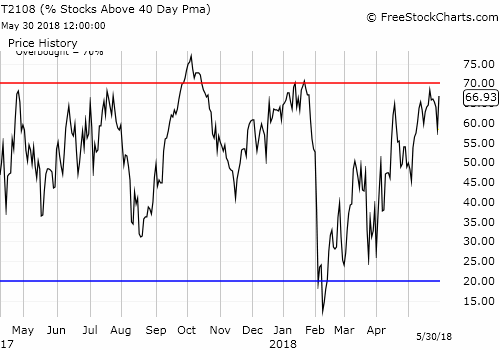
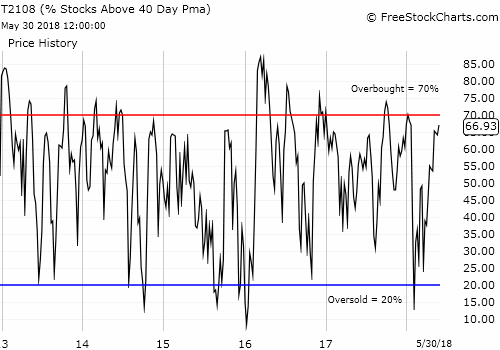
AT40 = 66.9% of stocks are trading above their respective 40-day moving averages (DMAs)
AT200 = 54.3% of stocks are trading above their respective 200DMAs (a near 4-month high)
VIX = 14.9
Short-term Trading Call: neutral
Commentary
Oh the hazards of changing short-term trading calls in this churning market! Reluctantly, I switched my short-term trading call from neutral to bearish after Tuesday’s sell-off drove AT40 (T2108) out of its May uptrend with a lower low. My rules forced the issue. Fortunately, Wednesday’s trading opened so strongly that I barely had a chance to act on my bearish trading call. After doubling down on Boeing (NYSE:BA) put options, I took a step back and recognized the sellers and bears were beating a hasty retreat. While nothing on the ground in Italy changed, perceptions of its importance clearly changed. The currency markets confirmed the change in mood with the euro (NYSE:FXE) snapping back and the Japanese yen (NYSE:FXY) quickly reversing.
By the close of trading, the S&P 500 (via SPDR S&P 500 (NYSE:SPY)) gained 1.3% and neatly closed Tuesday’s gap down. The NASDAQ and the PowerShares QQQ Trust Series 1 (NASDAQ:QQQ) were just strong enough to make new 2 1/2 month highs. Small caps led the way with the iShares Russell 2000 (NYSE:IWM) gaining 1.6% and a fresh all-time high.
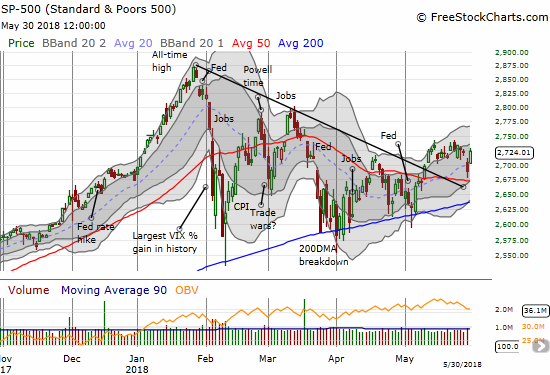
The S&P 500 (SPY) looks rallied well but it remains stuck in the muck of May’s churning highs.
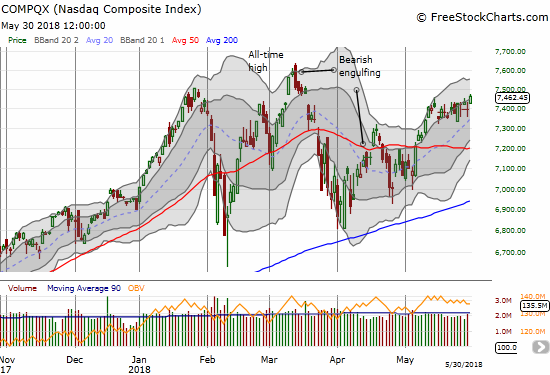
The NASDAQ needs to keep powering higher to avoid printing a potential head and shoulders top.
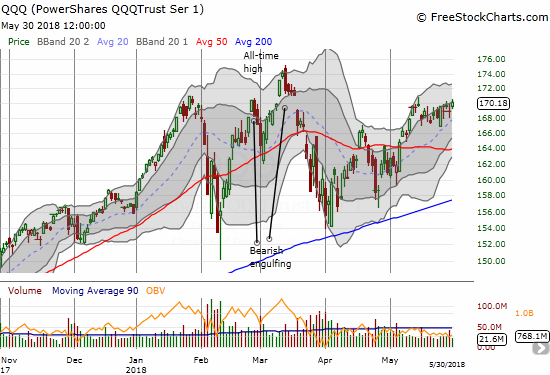
Ditto for the PowerShares QQQ ETF (QQQ): a head and shoulder top looms if the buying momentum does not continue from here.
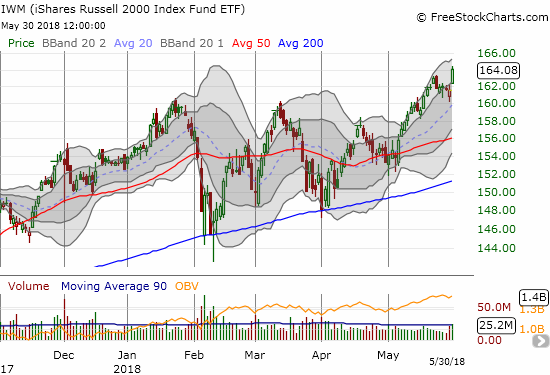
The Shares Russell 2000 ETF (IWM) looks as strong as ever. What pullback?
Needless to say, I snapped my short-term trading call right back to neutral. It is not bullish because, even though small caps look great, the fat cat indices still have a lot to prove as described in the charts above. Moreover, AT40, the percentage of stocks trading above their respective 40-day moving averages (DMAs) has yet to confirm buying strength by flipping into overbought territory (over 70%). In fact, the last two rejections from the overbought threshold have taught (reminded) me that I need to get bearish upon the first rejection rather than wait for confirmation. The confirmations keep coming toward the tail end of the bearish run.
AT40 soared from 58.4% to 66.9%. Stocks clearly participated broadly in the rally. AT200, the percentage of stocks trading above their respective 200DMAs, stood out. AT200 jumped three percentage points to a level it has not seen since early February. If AT200 can stay above 50%, and even move higher from here, it will add some bullish healing to the broader market.
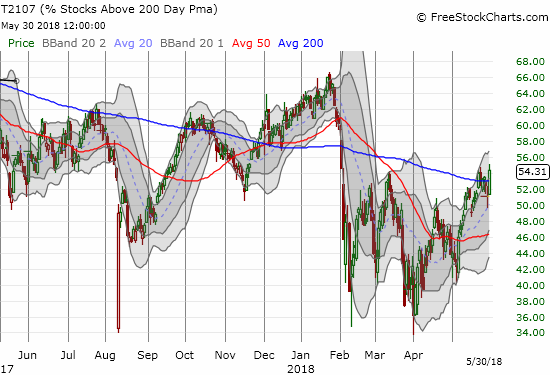
T2107 still has a longer-term downward trend, but bulls and buyers can take some encouragement from AT200’s ability to climb over 50%.
The volatility index, the VIX, confirmed the strength of the rally. The VIX gapped down and finished with a 12.2% loss. It closed at 14.9, just under the 15.35 pivot. I did not expect such a rapid reversal. I figured Tuesday’s spike meant selling pressure, and thus the VIX, could sustain itself through the remainder of the week. I took this opportunity to take profits on my short position in iPath S&P 500 VIX Short-Term Futures Exp 30 Jan 2019 (NYSE:VXX). VXX lost 5.1% on the day.
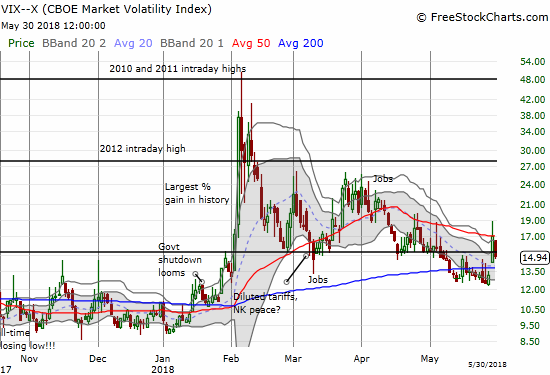
The volatility index, the VIX, was only able to spend one day above the 15.35 pivot.
CHART REVIEWS
Autozone (NYSE:AZO)
I missed the memo on AZO getting featured on Jim Cramer’s Mad Money, but I am glad I was one step ahead of today’s 3.9% continuation rally with the position I established last week. I dove right into post-earnings carnage and was fortunate to see the selling essentially stop on a dime after that day. After hours, Cramer stepped over Advanced Auto Parts (AAP) to target AZO as undervalued. Given I have a 640/650 call spread, I will likely close out the position this week on a further rally from current levels.
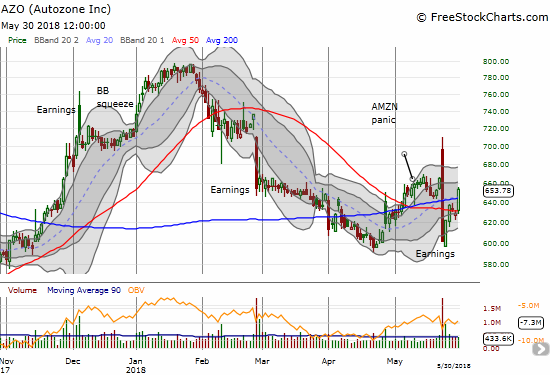
Autozone (AZO) soared 3.9% on the day with a picture-perfect bounce off 50DMA support and a slice right through 200DMA resistance.
Alcoa (NYSE:AA)
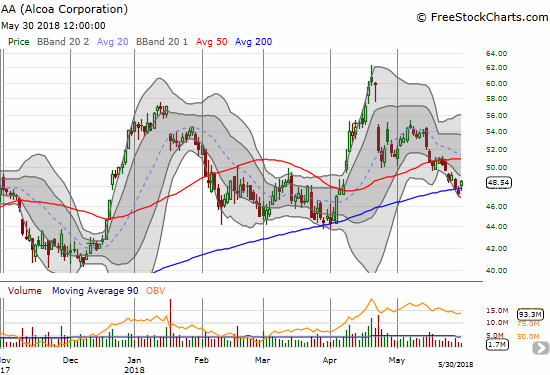
I had AA targeted for a buy given the re-awakening in commodity-related stocks. AA is perfectly positioned with a small bounce off 200DMA support. This support line held well in March. I was a little too conservative with my limit order and failed to establish a position. After hours, news headlines suggested that the Trump administration would not renew the European Union’s exemptions from steel and aluminum tariffs. Now I may need to chase a bit to ride AA’s latest rebound.
Alcoa (AA) makes another bid to solidify support at its uptrending 200DMA.
Dick’s Sporting Goods (NYSE:DKS)
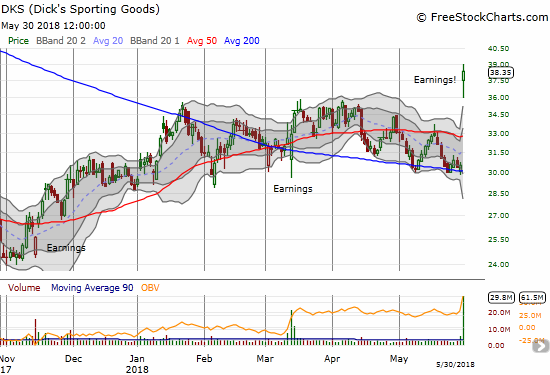
After I gave up on a broad-based retail revival for 2018, I narrowed my focus to a few promising retail stocks. Dick’s Sporting Goods (DKS) is my last one. I thought DKS would also be my last mistake as it could not break free of its declining 200DMA going into earnings. DKS delivered bigtime post-earnings with a 25.8% gain and a definitive breakout that confirms this stock is a buy on the dips. The move allowed me to salvage a call option (which I still sold a bit too early). I will also likely profit from my covered call position with the position being taken out at June expiration.
Dick’s Sporting Goods (DKS) broke out in style with a 25.8% post-earnings blast higher.
iShares US Home Construction ETF (NYSE:ITB) and iShares 20+ Year Treasury Bond ETF (NASDAQ:TLT)
The trading action in ITB suggests to me that the bots and algorithms are in control: higher interest rates = sell ITB, lower interest rates = buy ITB. This relationship is the main way I can explain the bizarre behavior in home builder stocks which features massive post-earnings skepticism and then rate-related buying and selling in between earnings-related data points.
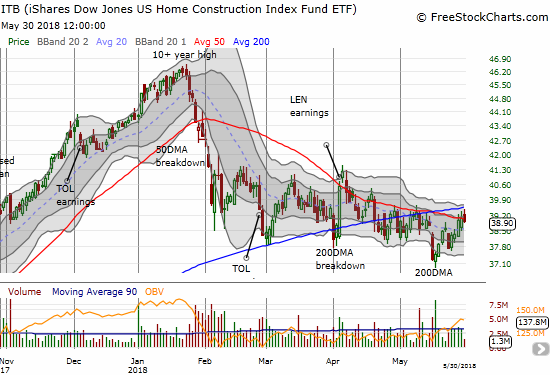
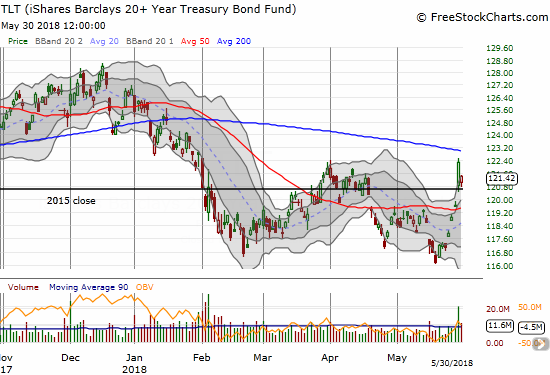
When the 10-year Treasury first cracked the 3.0% level, the move caused major angst in home builder stocks. ITB plunged and confirmed 200DMA resistance. Between then and now, buying has dominated the trading action as investors first anticipated and then were rewarded with lower rates. Bonds rallied sharply starting May 18th. ITB was even able to gain on Tuesday when the S&P 500 (SPY) fell over 1% because bonds rallied sharply (apparently the biggest one-day gain since Brexit in 2016). Today, bonds sold off again with TLT gapping all the way down to Tuesday’s big open. ITB responded by closing with a 0.4% loss that well under-performed the S&P 500’s 1.3% gain.
The iShares US Home Construction ETF (ITB) fell back despite the stock market’s sharp rally. While the decline was small and happened on very low trading volume, it may yet confirm resistance at/around the 200DMA.
The iShares 20+ Year Treasury Bond ETF (TLT) gapped down sharply at the open before recovering slightly. It finished with a 0.7% loss. Now it is not clear at all what higher/lower rates are supposed to say about economic health!
I quickly doubled down on my TLT puts but of course was left wishing I had done so during Tuesday’s TLT rally.
On a related note, Lennar (NYSE:LEN) was one of the biggest losers among home builders with a 1.5% drop. LEN’s pullback erases about 50% of the one-day gain it earned after CNBC’s Fast Money featured LEN for a trade. I still do not like the call, but I am watching the trading action closely.
“Above the 40” uses the percentage of stocks trading above their respective 40-day moving averages (DMAs) to assess the technical health of the stock market and to identify extremes in market sentiment that are likely to reverse. Abbreviated as AT40, Above the 40 is an alternative label for “T2108” which was created by Worden. Learn more about T2108 on my T2108 Resource Page. AT200, or T2107, measures the percentage of stocks trading above their respective 200DMAs.
Active AT40 (T2108) periods: Day #71 over 20%, Day #40 over 30%, Day #35 over 40%, Day #17 over 50%, Day #1 over 60% (overperiod), Day #85 under 70%
Black line: AT40 (T2108) (% measured on the right)
Red line: Overbought threshold (70%); Blue line: Oversold threshold (20%)
Be careful out there!
Full disclosure: long AZO call spread, long DKS shares and short call, long TLT puts, long BA puts, net short the euro and the Japanese yen

