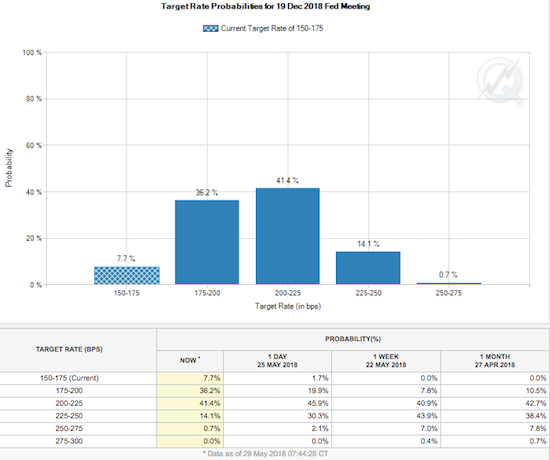
The odds of getting four total rate hikes from the Federal Reserve this year are about as low as ever now. Even the odds for just 3 total rate hikes for 2018 are ominously converging upon 50/50.
Adding from left to right, starting from the 225-250bps target range, the market indicates a 14.8% chance that December will deliver at least the 4th rate hike for 2018.
The chart above shows a 14.8% chance that rates will get to at least the 225-250bps (basis points) range by December. These odds have plunged quickly: from 32.4% on Friday and 51.3% just a week ago. Assuming 25bps increases with each hike, the Fed is not likely to hike three more times this year. The odds for rates to hit the 200-225bps range by December have dropped all the way to 56.2%. So now the more interesting question is whether the Fed will still squeak out TWO more rate hikes this year.
The direct and explicit culprit is now front and center coming from Italian political and financial turmoil. Moreover, a no-confidence vote is feared in Spain on Friday which could open the door for socialists. The safety trade is convincing traders and investors to bumrush into U.S. Treasury bonds and similarly become increasingly skeptical of the Fed’s ability to raise rates this year.
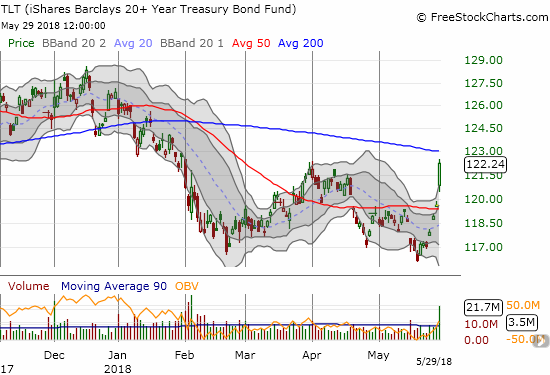
The iShares 20+ Year Treasury Bond ETF (NASDAQ:TLT) soared an astonishing 2.2% on the day. The rally caught me flat-footed as I just started buying TLT puts again on Friday. I still think inflation concerns will drive rates back up in the U.S., but I am waiting until at least Wednesday before doubling down on the TLT position.

The iShares 20+ Year Treasury Bond ETF (TLT) soared to a near 4-month high. Did it also confirm a double-bottom at the 2018 low?
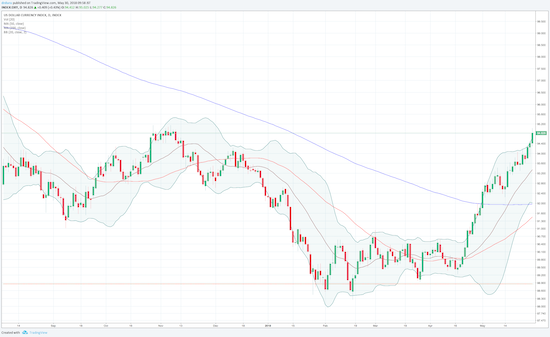
With the euro (NYSE:FXE) plunging along with rates, the U.S. dollar index (DXY) continues to get a boost. The combination of lower rates in the U.S. and a stronger dollar should continue to raise red flags for the “strong economy” trade in 2018.

The U.S. Dollar index (DXY) continues to creep higher in a challenge to the November high.
As I noted in my last quick review of the Fed rate hike odds, I am now pondering the potential impact on the stock market. Again, the low in the U.S. dollar index coincided with the 2018 sell-off in the stock market. The big stock rally in 2017 and into January of this year coincided with a dramatic and persistent decline in the U.S. dollar despite the prospects for higher interest rates.
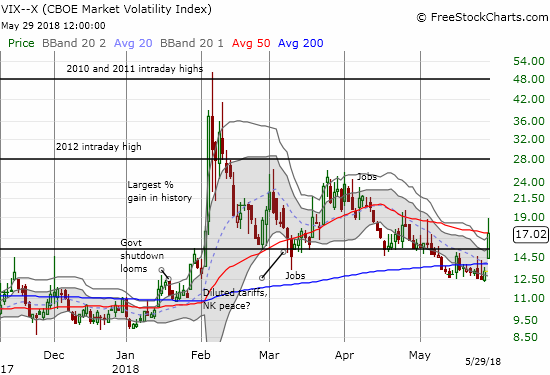
So how much higher does the U.S. dollar need to rise before stock market participants sit up, notice, and sell? The S&P 500 (via SPDR S&P 500 (NYSE:SPY)) gapped down on Tuesday and lost 1.2%. The volatility index, the VIX, is even more telling.

The volatility index confirmed a floor around 12.5 with Tuesday's 28.7% spike.
In earlier posts, I noted how the VIX seemed to be carving out a low for the current cycle. My observations prompted me to start buying call options on ProShares Ultra VIX Short-Term Futures (NYSE:UVXY) again. When the market gapped down Tuesday morning, I thought it was just another brief scare. So just as I did the last two rounds, I dutifully took profits soon after the open.
Much to my chagrin, I noticed that the VIX spike increased the value of those calls over 3x going into the close with the VIX up as much as 42.1% at one point. That missed profit perhaps ranks as my largest lost opportunity of the year. I am not sure there is a specific lesson here without hindsight except to say that I could have taken more time to examine the context of today’s trading.
A related sidebar…
I got a kick out of listening to Jim Cramer today explain how and why this increase in uncertainty is a good thing because lower rates and lower oil prices are good for U.S. businesses and consumers. Cramer berated the bears for trying to have it both ways when saying higher rates would squelch the economy and lower rates flag an economy going into a dive. However, bulls cannot have it both ways either. I seem to recall Cramer’s past reassurances that higher rates are a great sign of a strengthening economy.
Indeed, in recognition that “this too shall pass”, I started a fresh short on shares of iPath S&P 500 VIX Short-Term Futures Exp 30 Jan 2019 (NYSE:VXX). I think of this short as a background trade – meaning that I am betting on the inevitability of gravity pulling on this ETN over time and not worrying so much about the specific timing of my entries.
Also, as I stated above, I am still looking ahead to higher rates driven by inflationary pressures. It is not possible to celebrate the good impact of today’s action without recognizing the necessary return to the prior rate regime. So will rising rates and/or rising oil prices become bad or good signs? I guess it all depends on the prevailing narratives. In the meantime, my favorite technical indicator, AT40 (T2108), broke its last low which, per my rules, forces me to switch my short-term trading call to bearish even at the risk of having to churn right out of this call in a matter of days.
Be careful out there!
Full disclosure: long and short the U.S. dollar across various currency pairs, long TLT puts, short VXX shares

