📈 Will you get serious about investing in 2025? Take the first step with 50% off InvestingProClaim Offer

8 Still-Bullish Indices Looking More Anemic

Published 02/18/2021, 01:08 AM
Updated 07/09/2023, 06:31 AM
US500
-
US2000
-
SPY
-
DJT
-
DJA
-
DJUSIN
-
DJUSUT
-
XMI
-
XOI
-
VIX
-

Almost precisely one year ago today, all holy hell was about to break loose in the financial markets because of COVID-19. My, how times have changed.

Trillions of dollars later, the problems have been spackled and shellacked to oblivion. Let’s take a fresh look at eight important cash index markets.

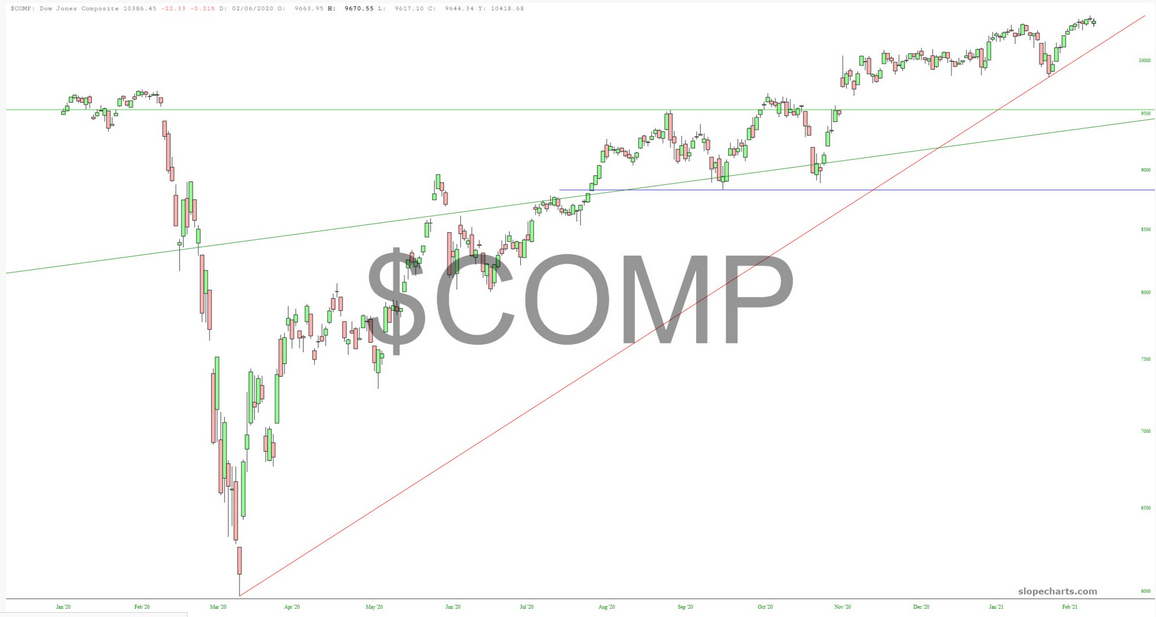
The Dow Composite is holding steady. That ascending trendline is all that matters at this point. The market seems relatively weak at this point, grinding it out day to day, but until and unless that trendline is broken, the bulls remain in control.
COMP Chart

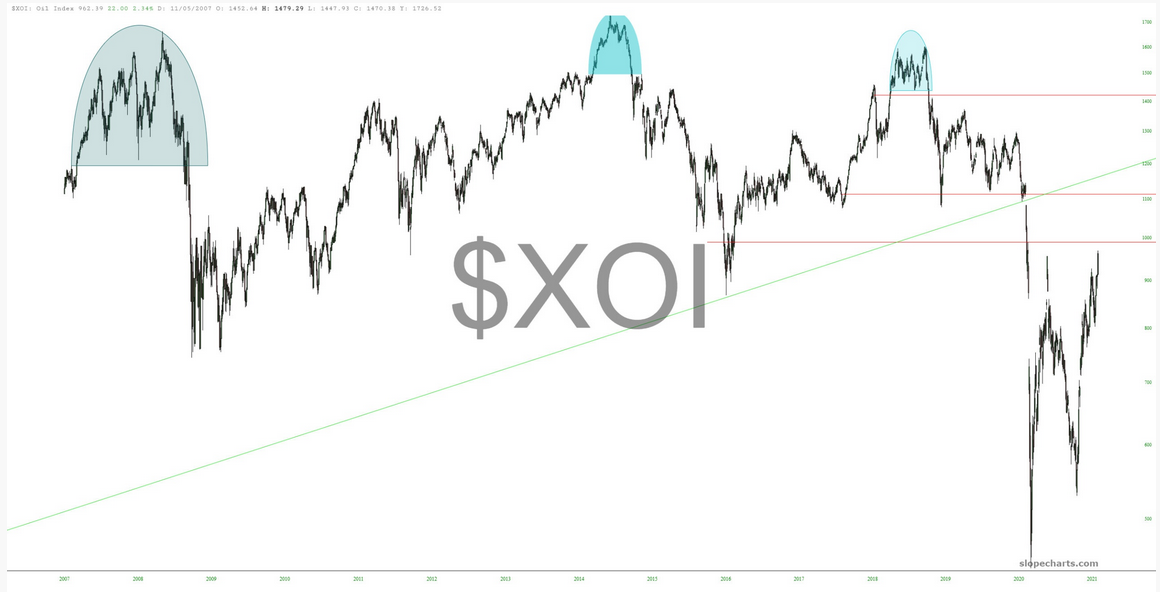
Everyone and his brother is bullish on energy these days—I have seen nothing but wild-eyed bull stories about all-things-energy lately— but I contend that the surge we’ve seen in both commodities and, more importantly, energy companies, is about over.
XOI Chart

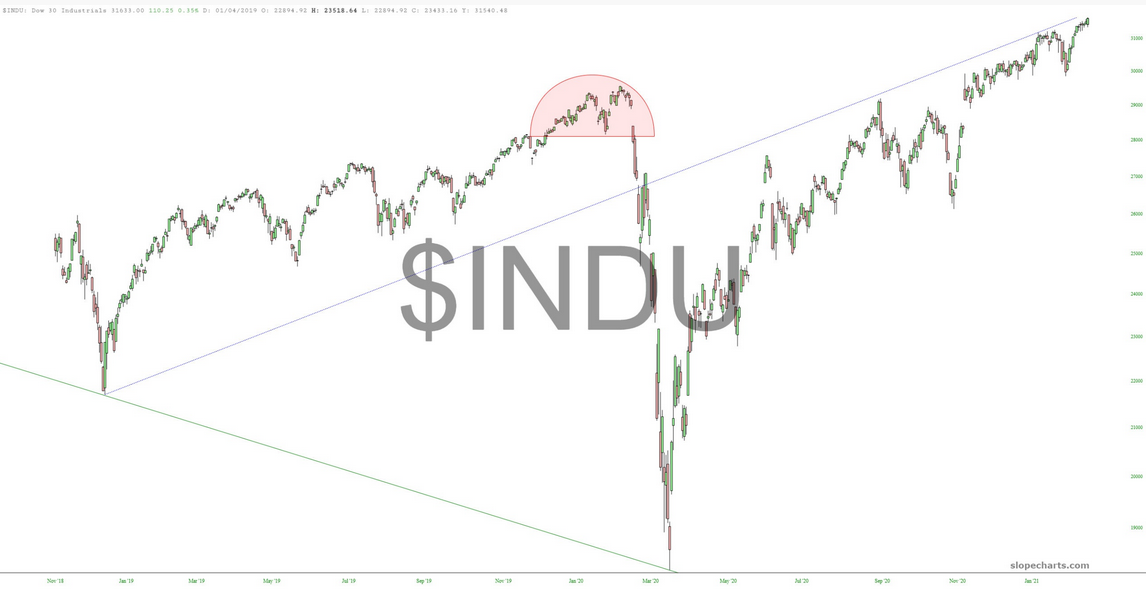
Returning to the Dow indexes, the Dow Jones Industrials has been creeping along the underside of its broken trendline for months now. The sea-change that took place was the COVID crash. That mutated the trendline from support to resistance.
INDU Chart

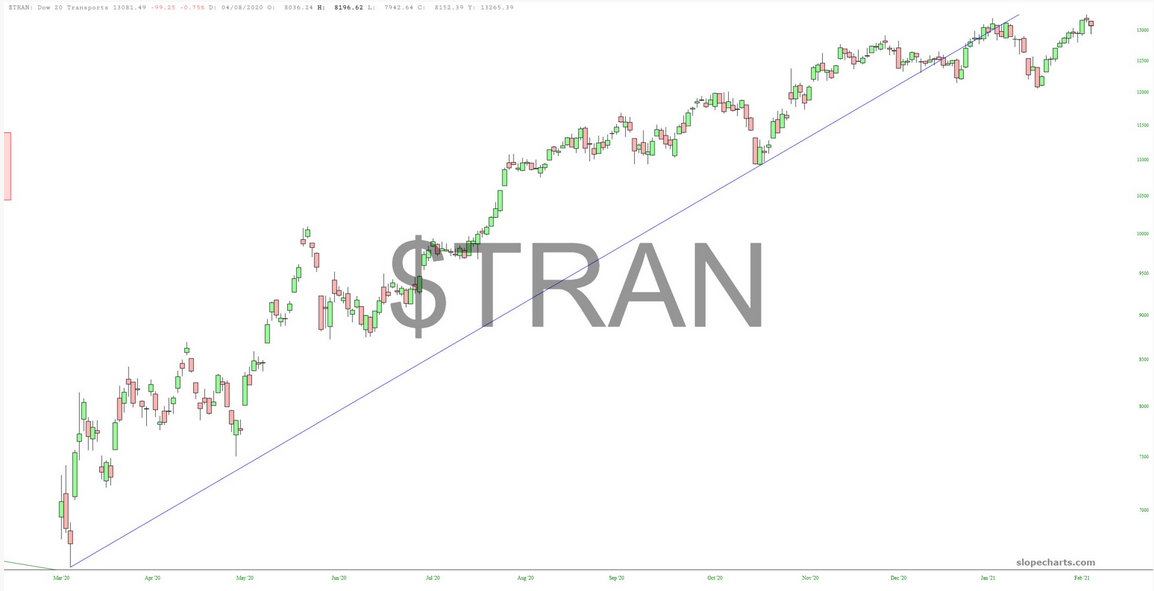
The failure of the Transports line is more recent. Although I am not showing the Dow Utilities here (which rounds out the final part of the Composite as a whole), it has been dragged down lately due to soaring interest rates.
TRAN Chart

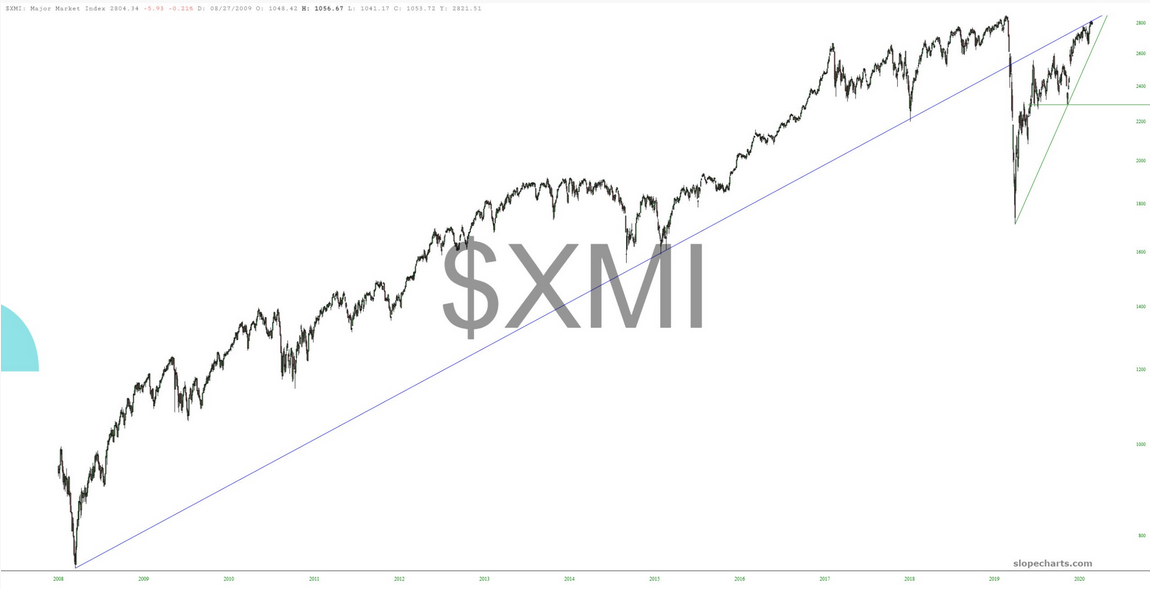
One of my favorite long-term charts is the Major Market Index. Just take a look at that triangle apex—beautiful!
XMI Chart

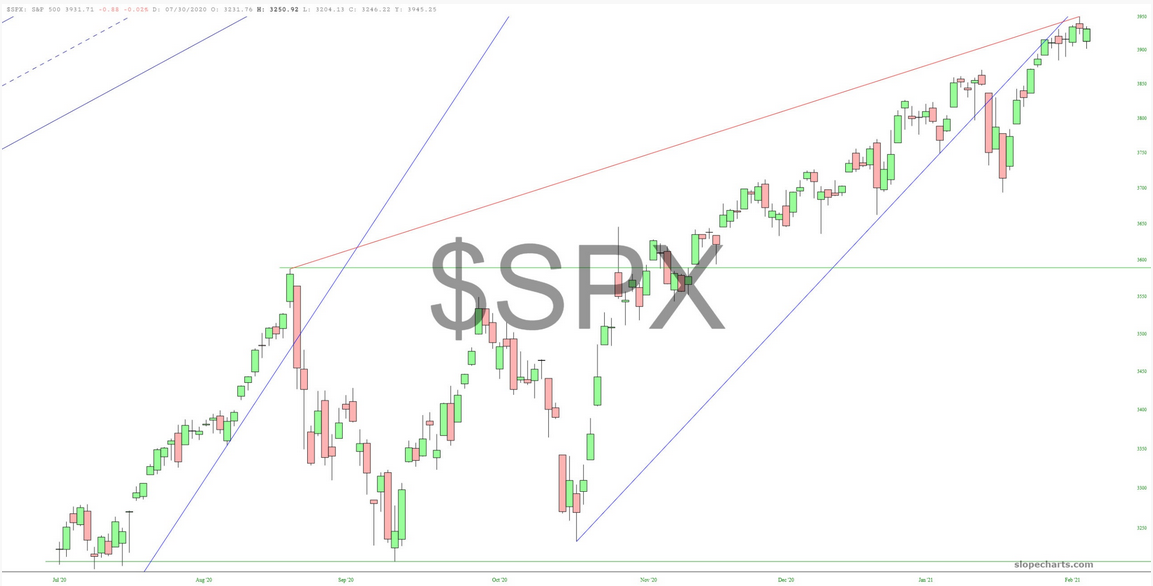
Equally as pretty, although covering a much shorter span of time, is the S&P 500. This wedge has been cleanly broken, and Tuesday we kissed the exact apex perfectly.
SPX Chart

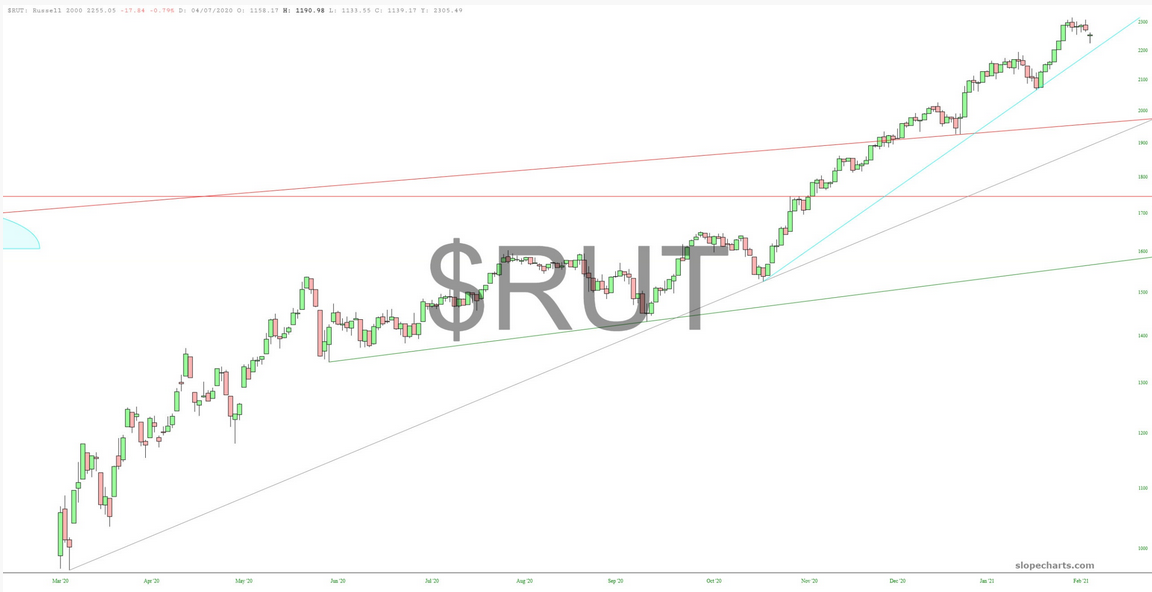
One of the superstars over the past four months has been the small caps. There are two trendlines to watch here: a short-term and a medium-term one. One good, strong, down-day would snap the short-term.
RUT Chart

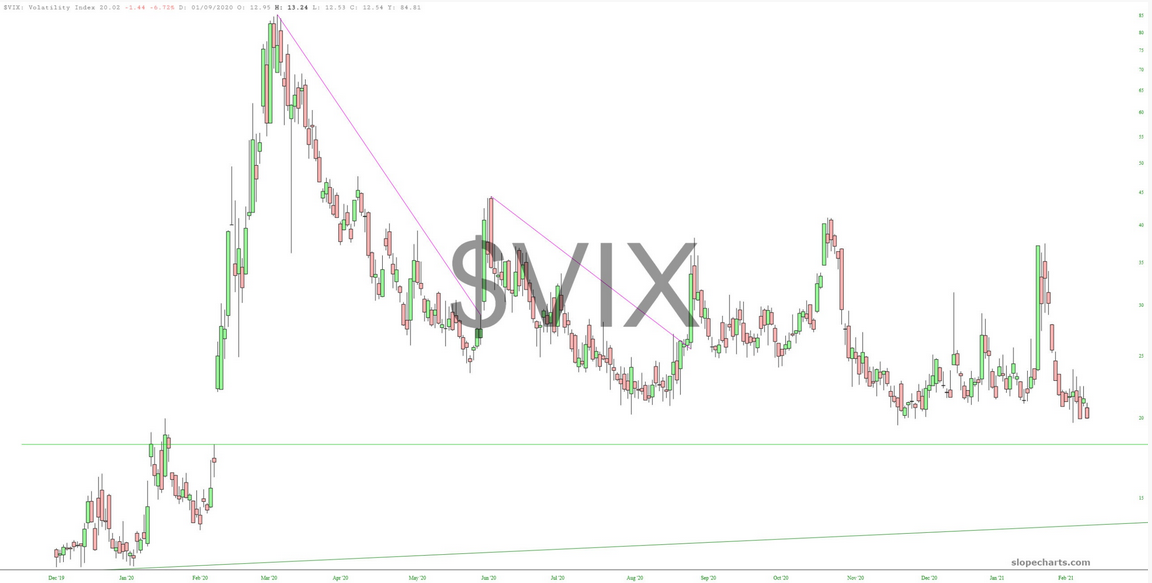
Lastly, in case you hadn’t noticed, traders around the world are falling asleep at their keyboards, and it’s easy to see why: volatility has been beaten and battered down to a coma, and we are at the lowest levels we’ve ever seen in the post-COVID era.

Pathetic, ain’t it? But perhaps an opportunity to go long volatility, as long as everyone is sleeping.
VIX Chart

Latest comments

Loading next article…
Risk Disclosure: Trading in financial instruments and/or cryptocurrencies involves high risks including the risk of losing some, or all, of your investment amount, and may not be suitable for all investors. Prices of cryptocurrencies are extremely volatile and may be affected by external factors such as financial, regulatory or political events. Trading on margin increases the financial risks.
Before deciding to trade in financial instrument or cryptocurrencies you should be fully informed of the risks and costs associated with trading the financial markets, carefully consider your investment objectives, level of experience, and risk appetite, and seek professional advice where needed.
Fusion Media would like to remind you that the data contained in this website is not necessarily real-time nor accurate. The data and prices on the website are not necessarily provided by any market or exchange, but may be provided by market makers, and so prices may not be accurate and may differ from the actual price at any given market, meaning prices are indicative and not appropriate for trading purposes. Fusion Media and any provider of the data contained in this website will not accept liability for any loss or damage as a result of your trading, or your reliance on the information contained within this website.
It is prohibited to use, store, reproduce, display, modify, transmit or distribute the data contained in this website without the explicit prior written permission of Fusion Media and/or the data provider. All intellectual property rights are reserved by the providers and/or the exchange providing the data contained in this website.
Fusion Media may be compensated by the advertisers that appear on the website, based on your interaction with the advertisements or advertisers.
© 2007-2025 - Fusion Media Limited. All Rights Reserved.