Here is your Bonus Idea with links to the full Top Ten:
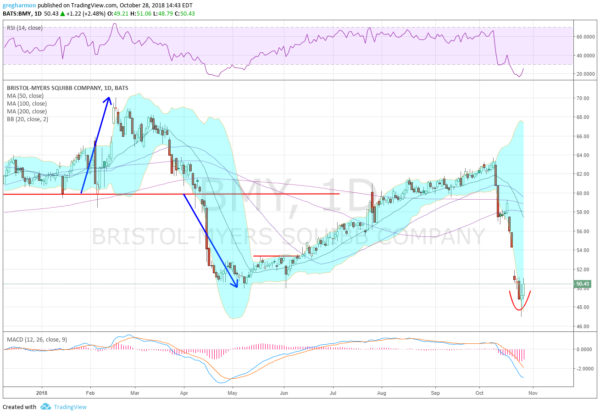
Bristol-Myers Squibb Company (NYSE:BMY), rose up off of support in February and then fell back. It broke through that support and traveled lower an equal distance below before bouncing. That was followed by a steady run higher to a top in October. This was a lower high and the reversal from there was fast and brutal. It culminated (maybe) with a gap down to start last week and then support and a rebound Friday. The bounce Friday confirmed the Hammer reversal candle from Thursday.
The RSI is deeply oversold and reversing higher, while the MACD continues to move lower. There is resistance at 51.35 and 53.40 then gap to fill to 54.30 followed by 57.60 and 59. Support lower comes at 48.80. Short interest is low under 1%. The company is expected to report earnings next on February 4th. The stock carries a 3.17% dividend but went ex- on October 4th so it should be January before the next record date.
The November options chain shows very large open interest at the 57.50 put and some size at the 57.5 call as well as the 51, 52 and 55 calls. All are above the current price putting upward pressure on the stock. The December chain shows biggest open interest at the 45 put and then on the call side it grows from 50 moving higher. The January chain has big open interest at the 40 and 45 puts below, as well as at the 50 through 55 puts above. On the call side the January open interest is focused from 50 to 60.
Bristol-Myers Squibb, Ticker: $BMY
Trade Idea 1: Buy the stock on a move over 51.50 with a stop at 48.50.
Trade Idea 2: Buy the stock on a move over 51.50 and add a November 50/45 Put Spread ($1.00) for protection.
Trade Idea 3: Buy the December/January 55 Call Calendar for 40 cents.
Trade Idea 4: Buy the January 45/55 bullish Risk Reversal for 22 cents.
After reviewing over 1,000 charts, I have found some good setups for the week. This week’s list contains the first five below to get you started early. These were selected and should be viewed in the context of the broad Market Macro picture reviewed Friday which heading into the last days of October and the last full week before the midterm elections, saw stocks get rocked. The S&P 500 and Nasdaq 100 have dropped more than 10% from their highs at the end of September with the Russell 2000 more than 15% off its high.
Elsewhere look for Gold to pause in its uptrend while Crude Oil pauses in its downtrend. The US Dollar Index is meeting resistance in its short term uptrend while US Treasuries are digesting their run lower. The Shanghai Composite is searching for a bottom but Emerging Markets are continuing to the downside. Volatility looks to remain elevated and possibly rise further keeping the bias lower for the equity index ETF’s SPY (NYSE:SPY), IWM and QQQ. Their charts look like they agree with that, all 3 in solid short term downtrends and now downtrends on the intermediate timeframe as well. Use this information as you prepare for the coming week and trad’em well.
The information in this blog post represents my own opinions and does not contain a recommendation for any particular security or investment. I or my affiliates may hold positions or other interests in securities mentioned in the Blog, please see my Disclaimer page for my full disclaimer.
