It will be a busy week for the markets with loads of economic data, earnings, and an FOMC meeting. It will be likely to set up a trend for the remained of the summer with positive news to help supply the market with the fuel needed to push shares higher, while disappointing results in sending shares lower.
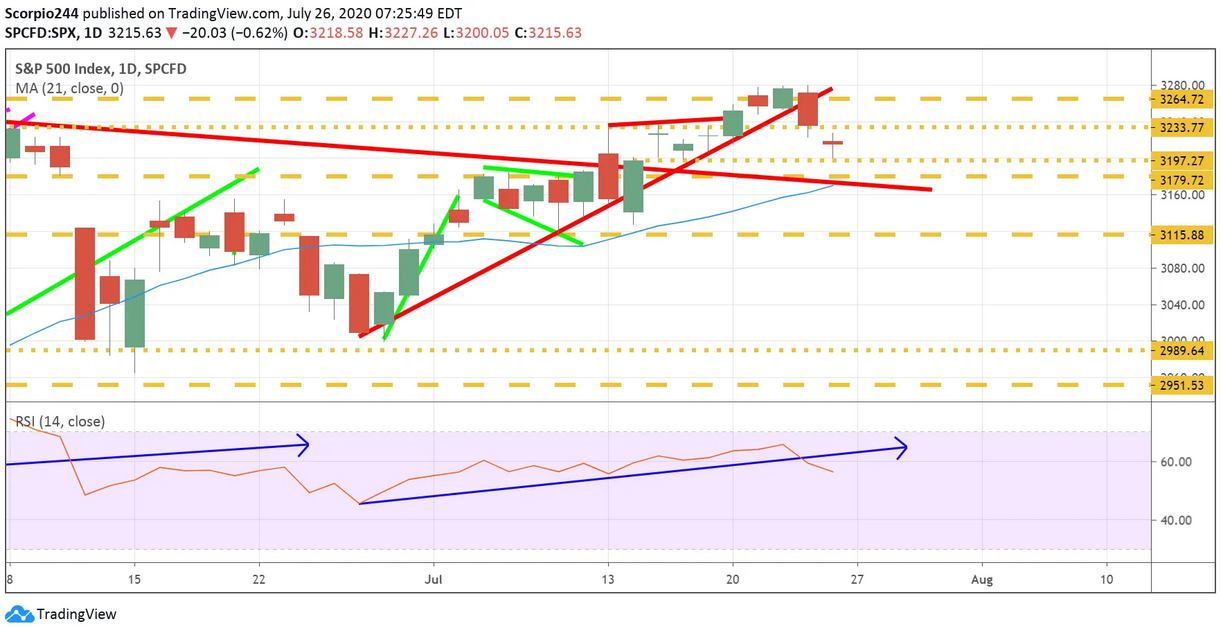
The S&P 500 finished the week off its highs and found itself in a dangerous spot as it attempts to hold on to a critical support level. The S&P 500 had been trending higher since the end of June, forming a couple of bullish patterns along the way. But now that uptrend is broken. A drop below 3,200 sets up a drop to around 3,180 but triggers the possibility for a decline to approximately 3,115. Additionally, the RSI has seen its uptrend broken as well, suggesting the index test and falls below 3,180.
NASDAQ 100
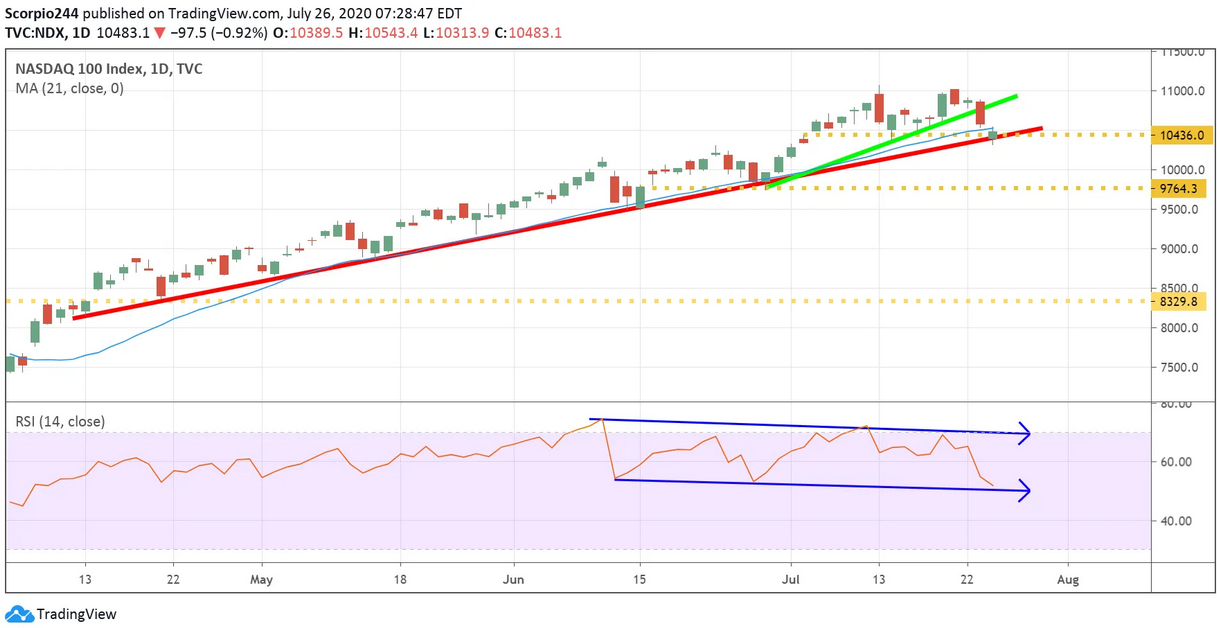
The Nasdaq 100 finds itself sitting on a crucial uptrend, and break of that uptrend triggers a sell-off to around 9,760. The RSI trend has also changed from higher to lower.
Amazon
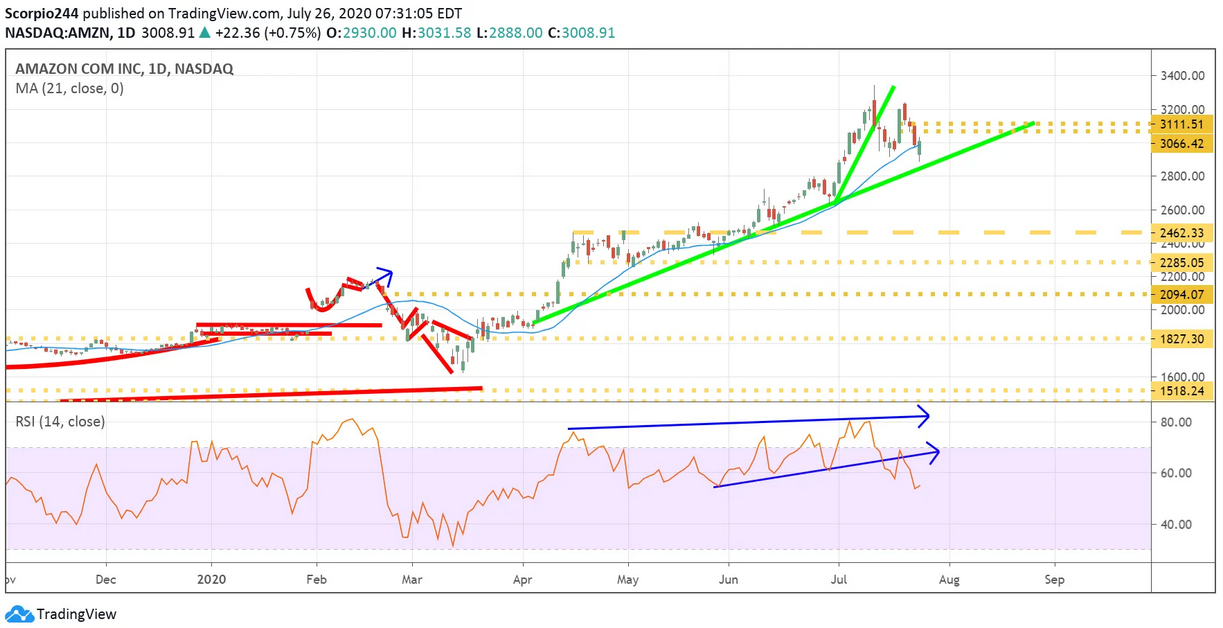
Meanwhile, Amazon (NASDAQ:AMZN) will report results on Thursday afternoon, and this stock is searching for its next level of support, which comes around 2,800. A drop below the uptrend can quickly send shares to approximately 2,450.
Apple
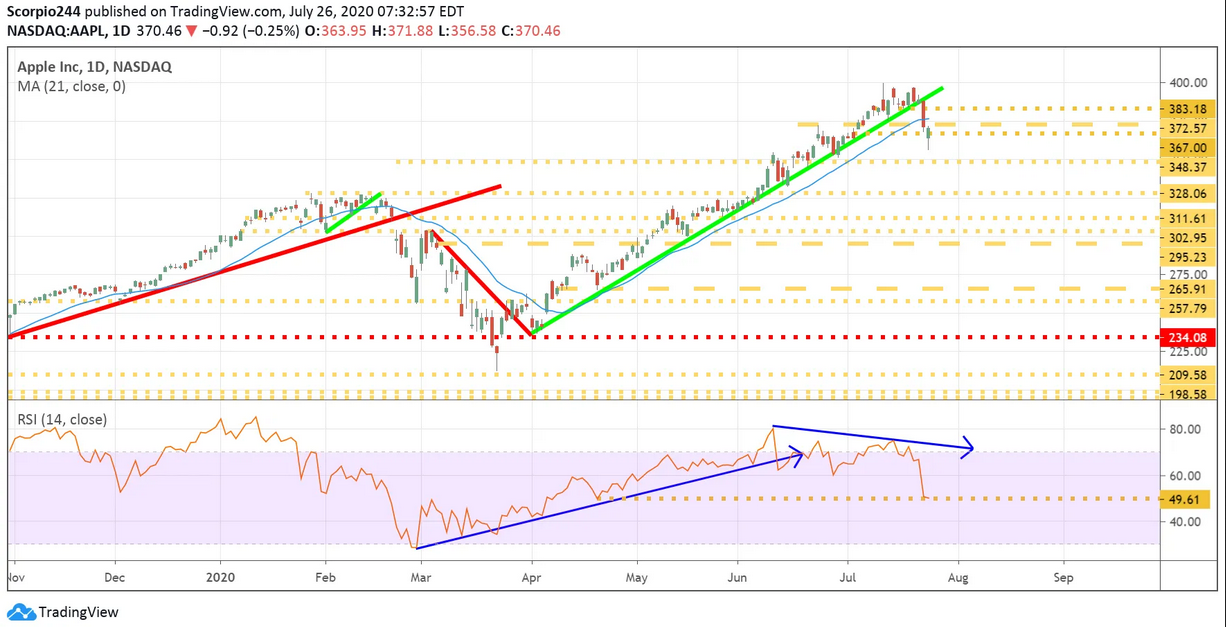
Apple (NASDAQ:AAPL) will report results on Thursday afternoon also, and it has already broken its uptrend. A drop below $348, sets up a further decline to around $330. Again, the RSI here is pointing to lower prices.
Alphabet
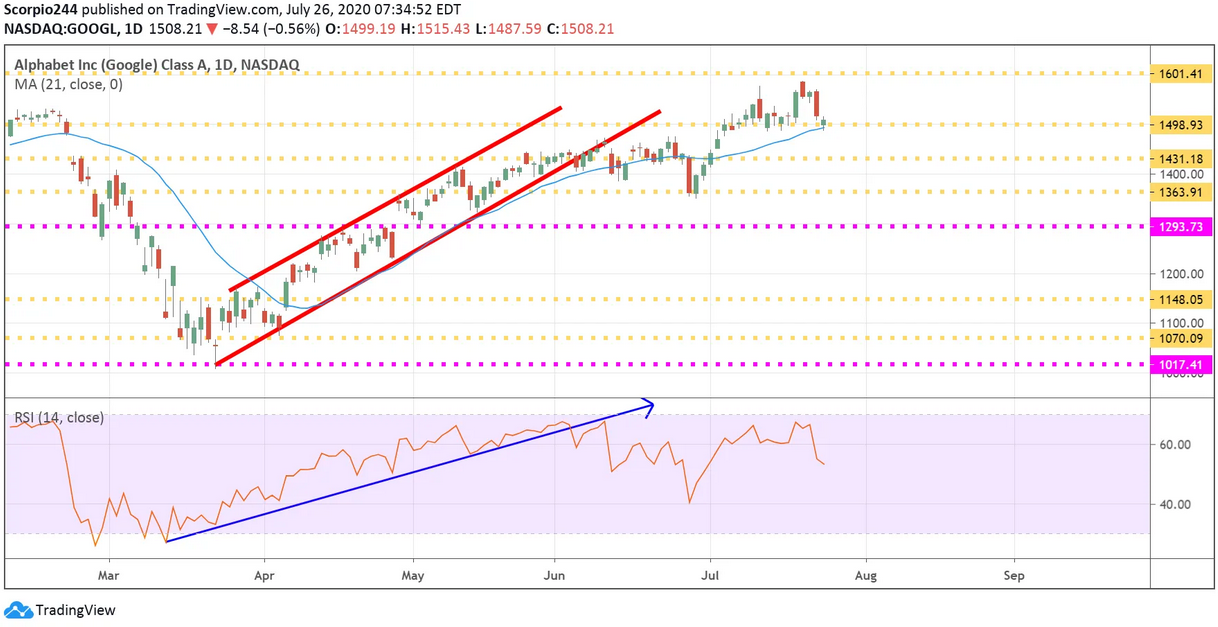
Alphabet (NASDAQ:GOOGL) will report on Thursday as well, and this stock finds itself at critical support at $1,500. Again the RSI, points to lower prices, with a support at $1,430.
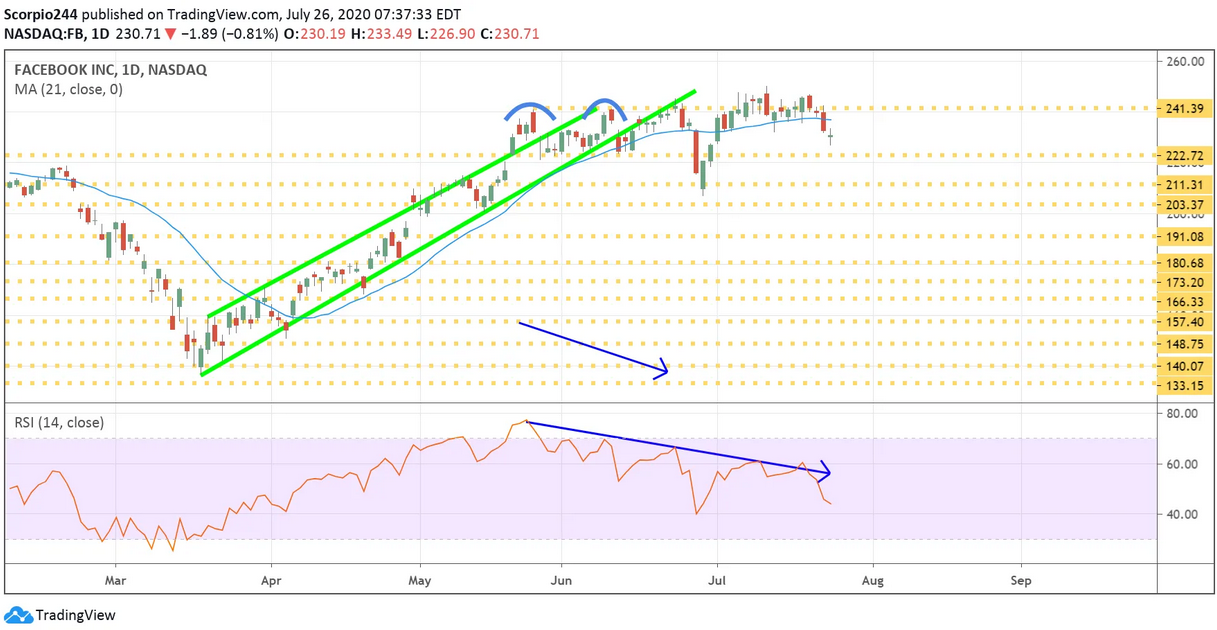
On Wednesday afternoon, Facebook (NASDAQ:FB) will report results, and this stock has struggled for a few weeks now. Again, the RSI points lower, and the stock has stalled around $240. I think the stock falls back to $211.
PayPal
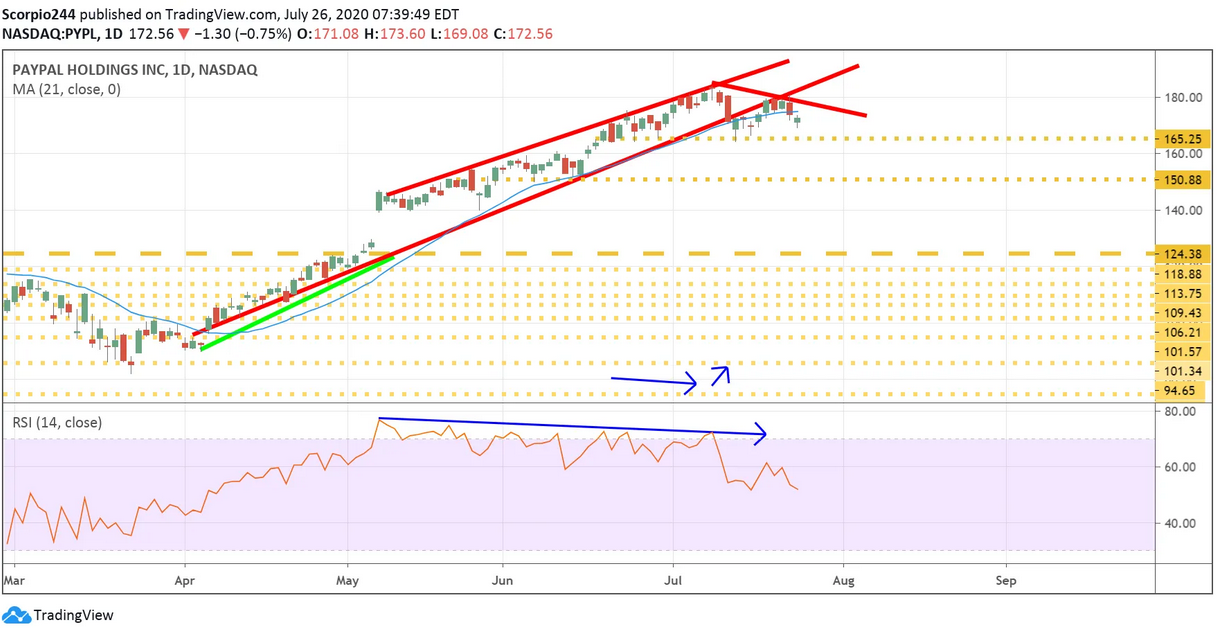
PayPal Holdings (NASDAQ:PYPL) will also report results on Wednesday afternoon, and this stock has soared in 2020. But it seems like that big run has come to an end. There is a giant gap to fill around $124. While I don’t think the gap gets filled this week, a drop to $151 seems possible.
Shopify
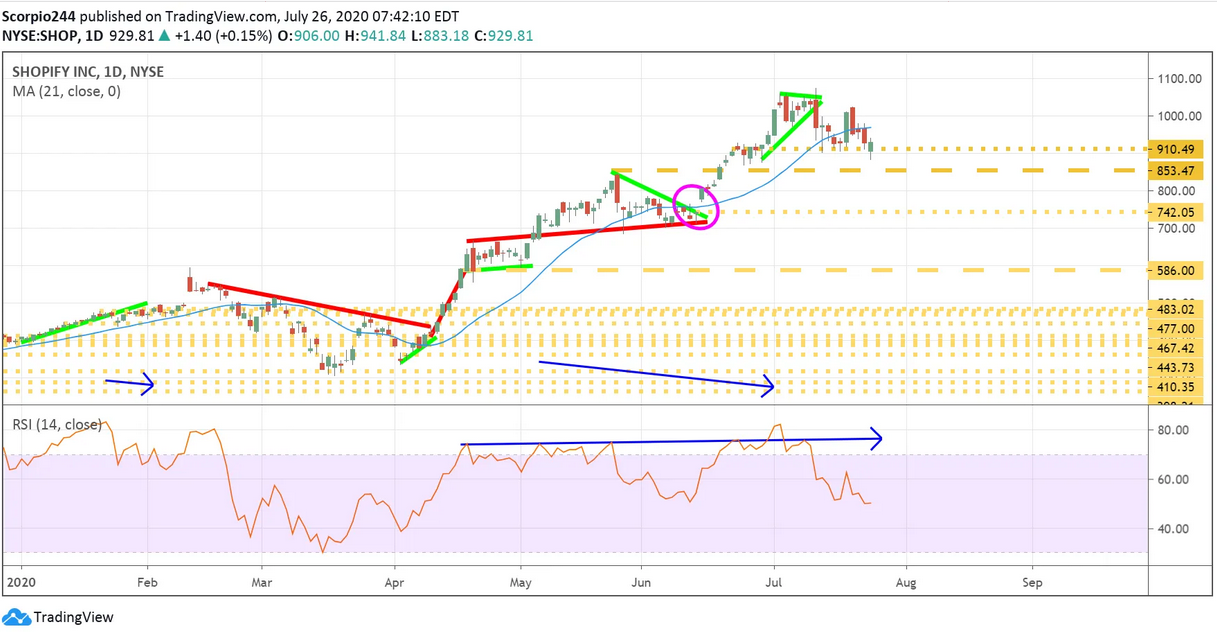
Shopify (NYSE:SHOP) will report results on Wednesday morning. This stock has seen its valuation rise to crazy levels. I still tend to think this stock heads lower to support around $742.
AMD
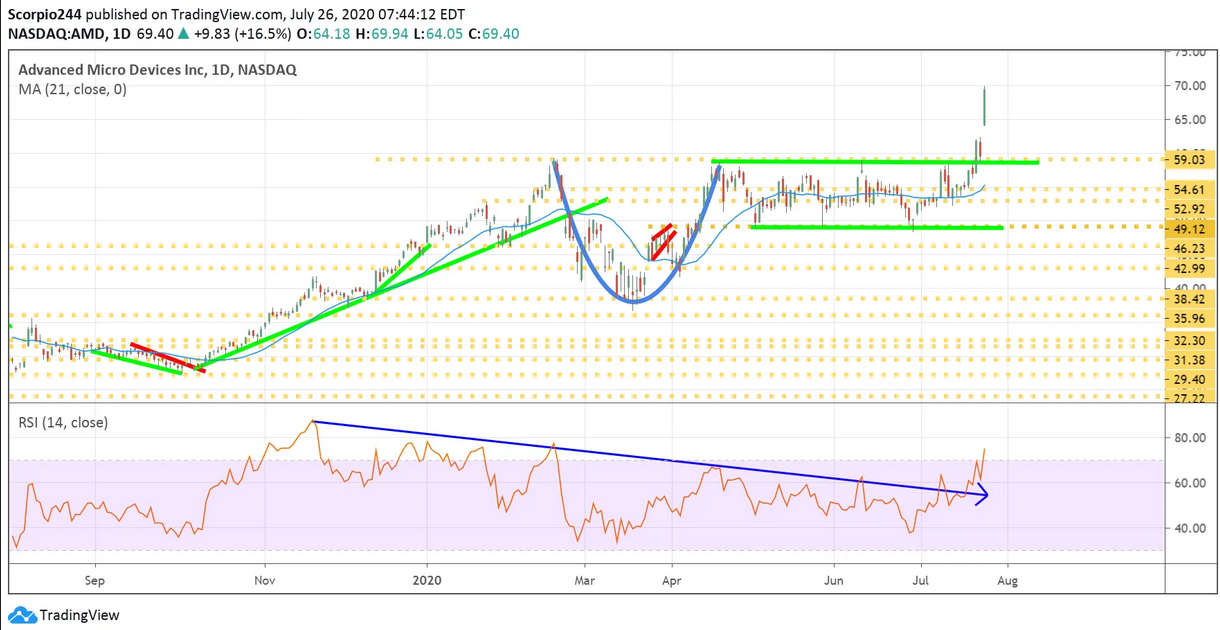
Advanced Micro Devices (NASDAQ:AMD) will report on Tuesday afternoon, and this stock broke last week. It has probably run-to-far-to-fast, and pulls back to and retest support at $59.
Boeing
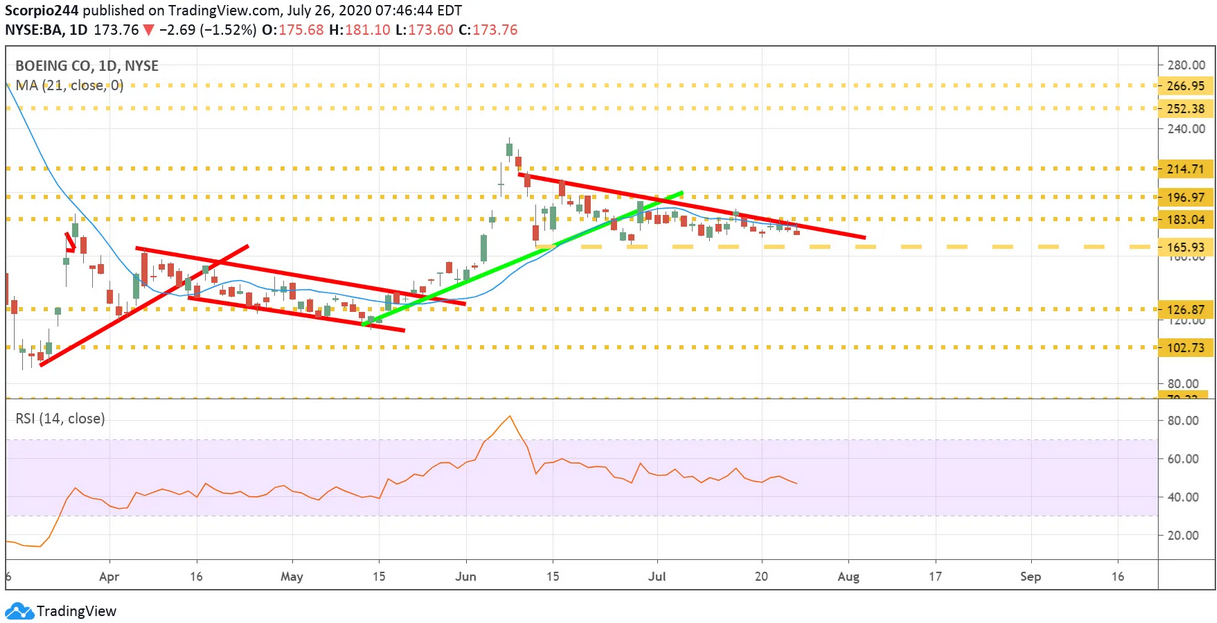
Finally, Boeing (NYSE:BA) will report on Tuesday morning, and the stock has formed a bearish descending triangle, which sets up a decline to $125.
