💎 Fed’s first rate cut since 2020 set to trigger market. Find undervalued gems with Fair ValueSee Undervalued Stocks

The market looks eerily similar to the days right before the 1987 crash

Published 10/10/2016, 11:49 PM
Updated 10/11/2016, 05:15 AM
© Citi

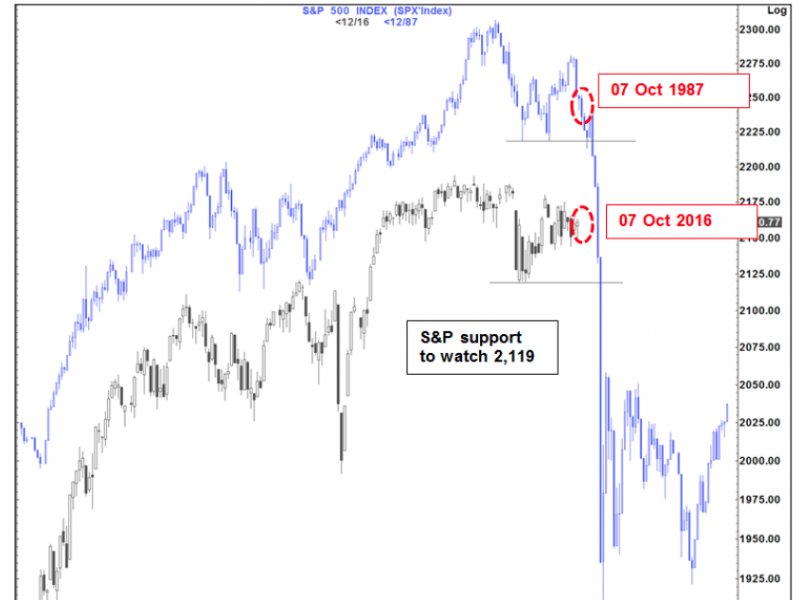
But when Citi's Tom Fitzpatrick and his team overlaid the current chart of the benchmark S&P 500 with the index in 1987 — right before the crash — they got "the chills."

On October 19, 1987, the Dow Jones Industrial Average suffered its biggest daily percentage loss, erasing 22.6% of its value. The S&P 500 also crashed.

Fitzpatrick is a top strategist at Citi and studies charts of trading patterns to forecast changes in the stock market.

Besides the similarity in the chart, Fitzpatrick cited four other reasons for his concern about the market right now.

He said in a note on Friday:

  • There's heightened concern about Europe and its banks. The UK has set a March 2017 date for when it will begin legal proceedings to exit the European Union, and Deutsche Bank (DE:DBKGn) failed to reach a swift deal that would lower its $14 billion fine with US authorities.
  • We're in "the most polarizing US presidential election in modern times."
  • More reports are circulating about central banks in Japan and Europe removing some of the economic stimulus they've provided by tapering their bond purchases. This is raising concerns about the efficacy of central bank policy around the world, Fitzpatrick said.
  • And finally, some peculiar market moves: a 16% move in oil prices within a week; a 20-basis-point shift in US 10-year yields in five days; and a $90 move in gold prices in nine days. The Chinese yuan and British pound have made massive moves in a short period of time, too.

Fitzpatrick said the support level to watch for the S&P 500 is 2,119. That's the critical floor below which traders are unlikely to allow the index to fall; if it breaks support, they'll be looking for a new floor.

On Monday, the S&P 500 opened at 2,165.05 and was up by 0.7% in early trading. It has gained 6% this year.

Latest comments

Risk Disclosure: Trading in financial instruments and/or cryptocurrencies involves high risks including the risk of losing some, or all, of your investment amount, and may not be suitable for all investors. Prices of cryptocurrencies are extremely volatile and may be affected by external factors such as financial, regulatory or political events. Trading on margin increases the financial risks.
Before deciding to trade in financial instrument or cryptocurrencies you should be fully informed of the risks and costs associated with trading the financial markets, carefully consider your investment objectives, level of experience, and risk appetite, and seek professional advice where needed.
Fusion Media would like to remind you that the data contained in this website is not necessarily real-time nor accurate. The data and prices on the website are not necessarily provided by any market or exchange, but may be provided by market makers, and so prices may not be accurate and may differ from the actual price at any given market, meaning prices are indicative and not appropriate for trading purposes. Fusion Media and any provider of the data contained in this website will not accept liability for any loss or damage as a result of your trading, or your reliance on the information contained within this website.
It is prohibited to use, store, reproduce, display, modify, transmit or distribute the data contained in this website without the explicit prior written permission of Fusion Media and/or the data provider. All intellectual property rights are reserved by the providers and/or the exchange providing the data contained in this website.
Fusion Media may be compensated by the advertisers that appear on the website, based on your interaction with the advertisements or advertisers.
© 2007-2024 - Fusion Media Limited. All Rights Reserved.