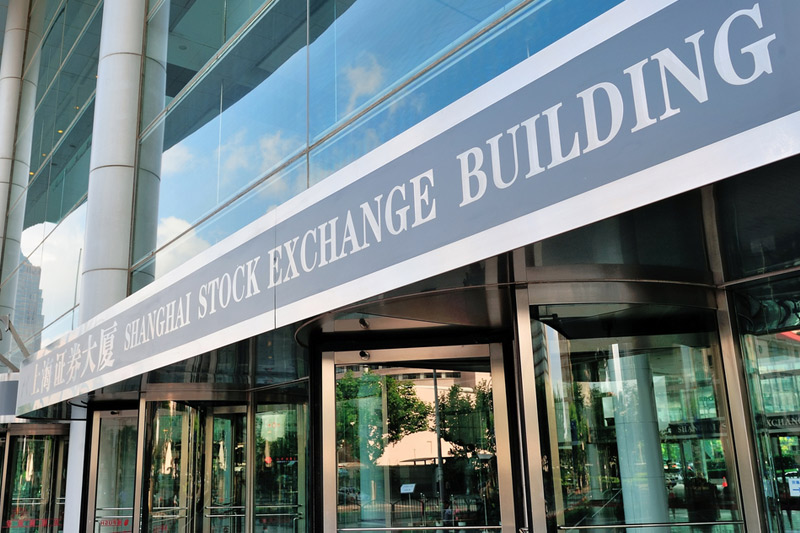
Investing.com – China stocks were lower after the close on Wednesday, as losses in the Banking, Electricity and Utilities sectors led shares lower.
At the close in Shanghai, the Shanghai Composite fell 0.79%, while the SZSE Component index fell 0.34%.
The best performers of the session on the Shanghai Composite were Double Coin-B (SS:900909), which rose 10.04% or 0.085 points to trade at 0.932 at the close. Meanwhile, Lianyungang Po (SS:601008) added 10.04% or 1.170 points to end at 12.820 and S Churin Group (SS:600891) was up 10.04% or 0.910 points to 9.970 in late trade.
The worst performers of the session were S Yizheng Chem (SS:600871), which fell 4.96% or 0.480 points to trade at 9.190 at the close. Loncin Motor (SS:603766) declined 4.90% or 0.960 points to end at 18.630 and Humanwell (SS:600079) was down 4.70% or 1.730 points to 35.090.
The top performers on the SZSE Component were Suzhou Gold Mantis Construction Decoration Co Ltd (SZ:002081) which rose 10.00% to 32.89, Suning Commerce Group Co Ltd (SZ:002024) which was up 7.04% to settle at 13.69 and Weichai Power Co Ltd (SZ:000338) which gained 5.74% to close at 30.05.
The worst performers were Pangang Group Vanadium Titanium & Resources Co Ltd (SZ:000629) which was down 3.74% to 4.12 in late trade, Shenzhen Overseas Chinese Town Co Ltd (SZ:000069) which lost 2.94% to settle at 9.26 and Ping An Bank Co Ltd (SZ:000001) which was down 2.87% to 14.91 at the close.
Falling stocks outnumbered advancing ones on the Shanghai Stock Exchange by 498 to 471.
Shares in Double Coin-B (SS:900909) rose to 3-year highs; gaining 10.04% or 0.085 to 0.932. Shares in Lianyungang Po (SS:601008) rose to all time highs; rising 10.04% or 1.170 to 12.820. Shares in S Churin Group (SS:600891) rose to 3-year highs; rising 10.04% or 0.910 to 9.970. Shares in Suzhou Gold Mantis Construction Decoration Co Ltd (SZ:002081) rose to all time highs; rising 10.00% or 2.99 to 32.89. Shares in Suning Commerce Group Co Ltd (SZ:002024) rose to 52-week highs; up 7.04% or 0.90 to 13.69. Shares in Weichai Power Co Ltd (SZ:000338) rose to 52-week highs; gaining 5.74% or 1.63 to 30.05.
The CBOE China Etf Volatility, which measures the implied volatility of Shanghai Composite options, was down 4.95% to 20.15 a new 6-month low.
Gold for April delivery was down 0.07% or 0.80 to $1190.60 a troy ounce. Elsewhere in commodities trading, Crude oil for delivery in May fell 0.79% or 0.38 to hit $47.13 a barrel, while the May Brent oil contract fell 0.46% or 0.26 to trade at $54.91 a barrel.
USD/CNY was up 0.14% to 6.2143, while EUR/CNY rose 0.19% to 6.7940.
The US Dollar Index was down 0.11% at 97.33.
