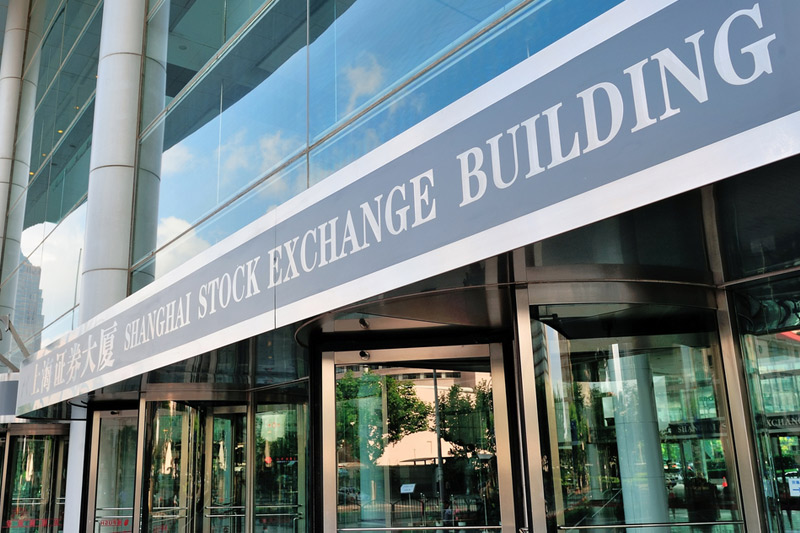
Investing.com – China stocks were higher after the close on Monday, as gains in the Real Estate Investments & Services, Oil Equipment Services & Distribution and Life Insurance sectors led shares higher.
At the close in Shanghai, the Shanghai Composite rose 2.62% to hit a new 3-year high, while the SZSE Component index added 2.48%.
The best performers of the session on the Shanghai Composite were Changlin (SS:600710), which rose 10.08% or 0.630 points to trade at 6.880 at the close. Meanwhile, Qingsong (SS:600425) added 10.07% or 0.740 points to end at 8.090 and Zhenhua Heavy (SS:600320) was up 10.07% or 0.770 points to 8.420 in late trade.
The worst performers of the session were Chaodong Cem (SS:600318), which fell 10.01% or 3.440 points to trade at 30.940 at the close. JS Design ORD A (SS:603018) declined 10.00% or 8.02 points to end at 72.20 and Huafang (SS:600273) was down 9.97% or 1.550 points to 14.000.
The top performers on the SZSE Component were Zoomlion Heavy Industry Science and Technology Co Ltd (SZ:000157) which rose 10.04% to 7.56, China Merchants Property Development Co Ltd (SZ:000024) which was up 10.00% to settle at 33.44 and China Vanke Co Ltd (SZ:000002) which gained 6.67% to close at 14.24.
The worst performers were Suzhou Gold Mantis Construction Decoration Co Ltd (SZ:002081) which was down 1.13% to 35.00 in late trade, BYD Co Ltd (SZ:002594) which lost 0.26% to settle at 52.71 and Midea Group Co Ltd (SZ:000333) which was unchanged 0% to 31.54 at the close.
Rising stocks outnumbered declining ones on the Shanghai Stock Exchange by 727 to 234.
Shares in Changlin (SS:600710) rose to 3-year highs; up 10.08% or 0.630 to 6.880. Shares in Qingsong (SS:600425) rose to 3-year highs; up 10.07% or 0.740 to 8.090. Shares in Zhenhua Heavy (SS:600320) rose to 3-year highs; up 10.07% or 0.770 to 8.420. Shares in Zoomlion Heavy Industry Science and Technology Co Ltd (SZ:000157) rose to 52-week highs; up 10.04% or 0.69 to 7.56. Shares in China Merchants Property Development Co Ltd (SZ:000024) rose to 52-week highs; gaining 10.00% or 3.04 to 33.44.
The CBOE China Etf Volatility, which measures the implied volatility of Shanghai Composite options, was up 1.93% to 20.56.
Gold for June delivery was down 1.02% or 12.20 to $1188.50 a troy ounce. Elsewhere in commodities trading, Crude oil for delivery in May fell 1.85% or 0.91 to hit $47.97 a barrel, while the May Brent oil contract fell 1.03% or 0.58 to trade at $55.83 a barrel.
USD/CNY was down 0.14% to 6.2065, while EUR/CNY fell 0.60% to 6.7274.
The US Dollar Index was up 0.49% at 98.09.
