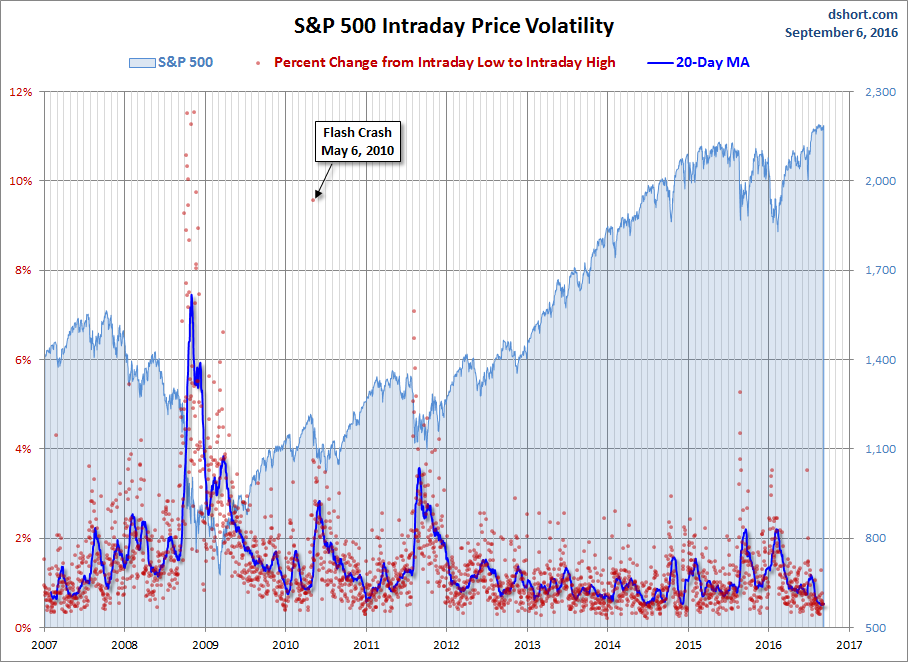
The S&P 500 opened higher but quickly sold off to its -0.22% intraday low with the 10AM release of the ISM Non-Manufacturing Purchasing Managers' Index, which hit its lowest level since early 2010. But a late-summer buy-the-dip mentality prevailed, and the index was trading back in the green by the lunch hour.
After all, a week services PMI on top of Friday's weak employment report will keep the Fed on hold, right? Bad news is good news. The index closed the session with 0.30% gain just a few ticks off its intraday high, and a mere 0.17% from its record close. In fact, it's tech-heavy cousin, the NASDAQ, did log a record close.
The yield on the 10-year note closed at at 1.55%, down five basis points from the previous close.
Here is a snapshot of past five sessions in the S&P 500.
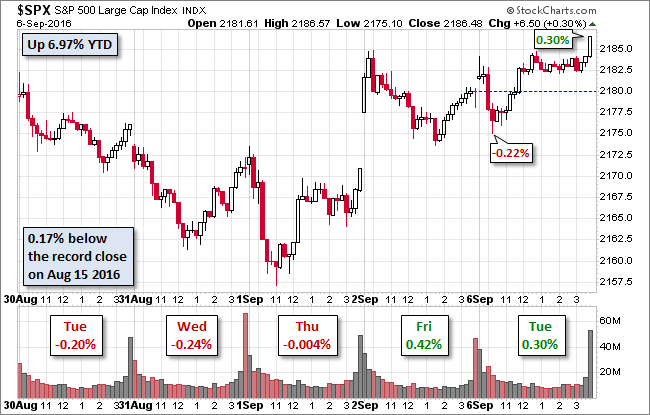
Here is daily chart of the index. Post-Labor Day volume moved back up to the vicinity of its 50-day moving average.
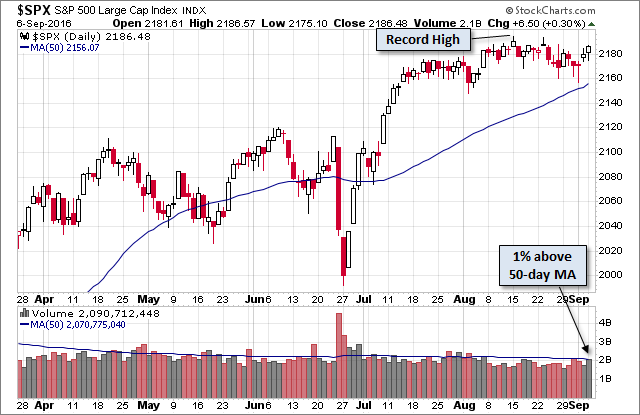
A Perspective on Drawdowns
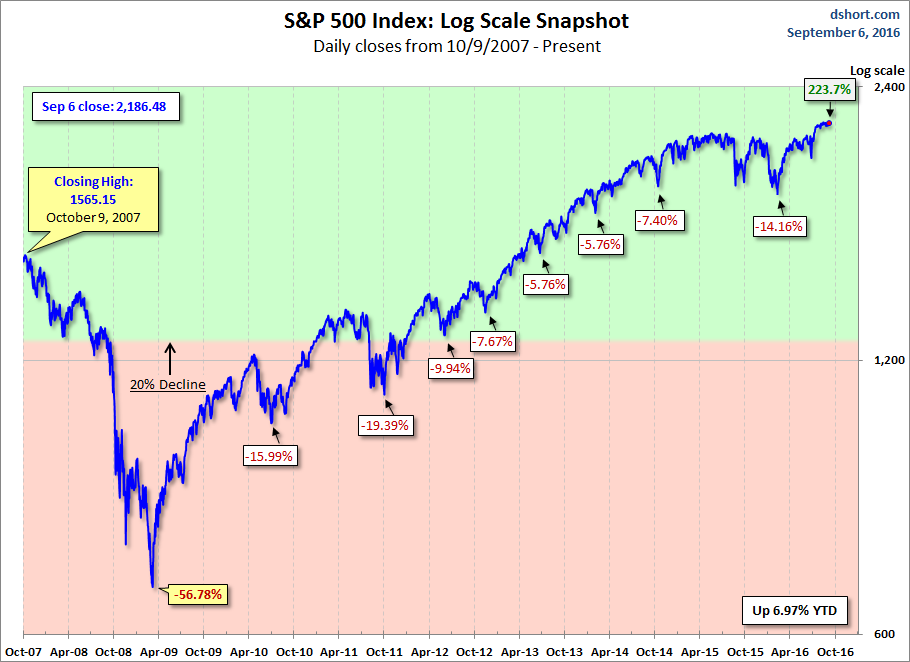
Here's a snapshot of selloffs since the 2009 trough.
Here is a more conventional log-scale chart with drawdowns highlighted.
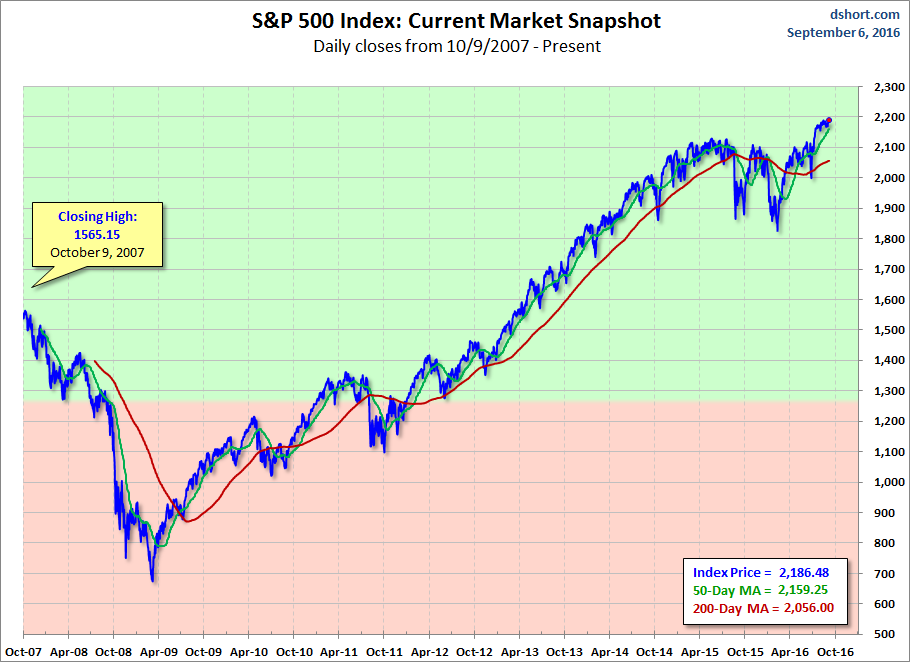
Here is a linear scale version of the same chart with the 50- and 200-day moving averages.
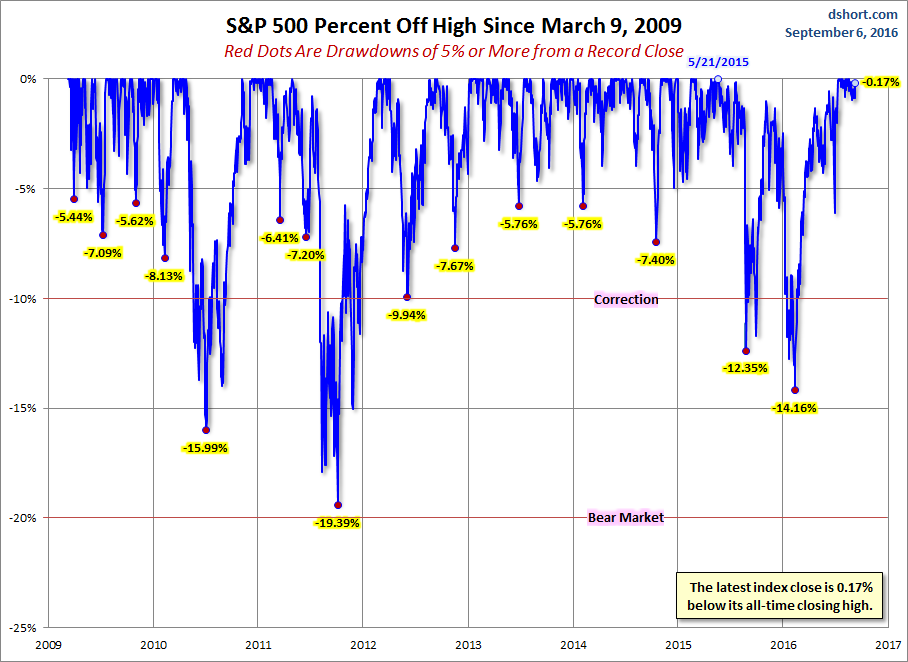
A Perspective on Volatility
For a sense of the correlation between the closing price and intraday volatility, the chart below overlays the S&P 500 since 2007 with the intraday price range. We've also included a 20-day moving average to help identify trends in volatility.
