For the better part of six years, between December of 2008 and December of 2014, the Federal Reserve created hundreds of billions of electronic dollar credits to pump up asset prices (e.g., stocks, bonds, real estate. etc.). Theoretically, the subsequent wealth effect would encourage businesses to invest in their growth, consumers to spend on discretionary items and the overall economy to improve dramatically.
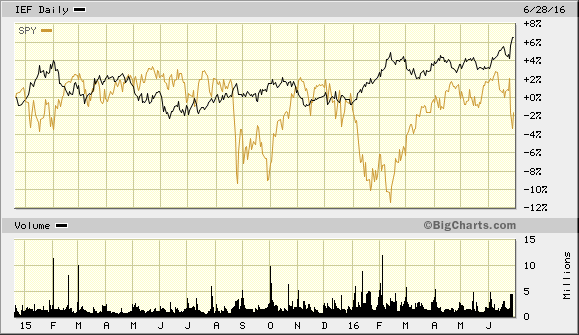
Since the Fed terminated its stimulus program (“QE3″), however, riskier assets have struggled and “risk-off” assets have thrived. For example, we can look at the performance of large-cap U.S. stocks versus “risk-off” Treasury bonds. The SPDR Trust (NYSE:SPY) has produced negative returns in the 18-month time frame. In the same period, iShares 7-10 Year Treasury Bond ETF (NYSE:IEF) has offered positive results with far less volatility.
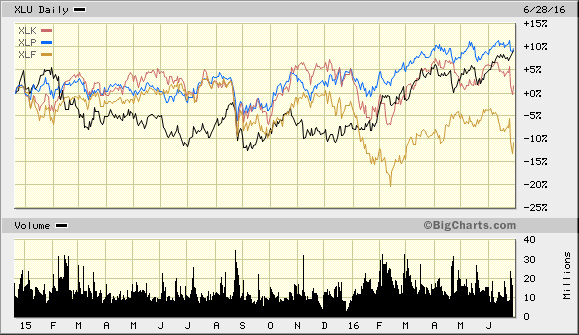
Let’s dig deeper. Non-cyclical segments less tethered to the well-being of the U.S. economy have outperformed cyclical sectors. In particular, SPDR Select Sector Consumer Staples (NYSE:XLP) and SPDR Select Sector Utilities (NYSE:XLU) are up roughly 10% over the year-and-a-half period. In contrast, SPDR Select Sector Technology (NYSE:XLK) is flat and SPDR Select Sector Financials (NYSE:XLF) is down 10%.
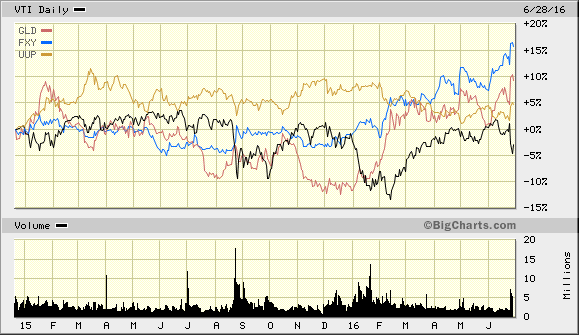
What’s more, there are other signs that risk aversion is more “in vogue” than risk taking. Currencies like the dollar and the yen often rise when financial market participants are troubled by stock prospects. Similarly, gold often comes back into favor when investors demand safer havens. While SPDR Gold Trust (NYSE:GLD) as well as CurrencyShares Japanese Yen Trust (NYSE:FXY) did not genuinely catch fire until the start of 2016, while PowerShares U.S. Dollar Bullish (NYSE:UUP) has actually lost a bit of ground year-to-date, the fact remains that all three of these “risk-off” assets have outperformed Vanguard Total U.S. Stock Market (NYSE:VTI) since QE3 ended (12/18/2014).
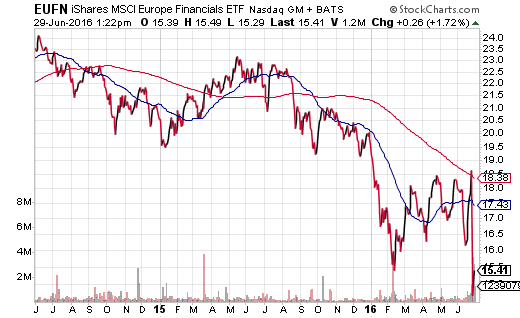
It is worth noting that during 2008 – during the bulk of the real-estate, subprime mortgage crisis – there were virtually no market-based security winners outside of U.S. Treasury bonds, the dollar, the yen and gold. This is not to suggest that we are on the verge of the next banking catastrophe stateside. On the other hand, few assets have been as eviscerated as much as European financials via iShares MSCI Europea Financials (NASDAQ:EUFN). This exchange-traded tracker has registered -36% since peaking two year earlier.
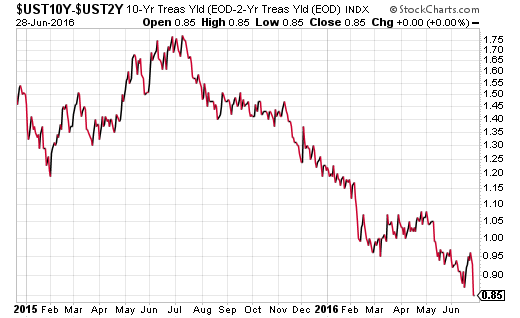
One additional area where risk aversion appears to be taking root? Credit spreads. We can see that since the S&P 500 reached its pinnacle in May of 2015, and since the Fed ceased creating electronic dollar credits in December of 2014 (“QE3″), the spread between 10-year and 2-year yields have cratered to a meager 0.85%. This activity basically makes it nearly impossible for the Fed to consider raising its overnight lending rate anytime soon; otherwise, a pancake flat yield curve might actually invert. And as many an amateur economist likes to opine, an inverted yield curve usually spells doom for the U.S. economy.
It is true that nobody can predict what the future holds. On the flip side, nearer-term (e.g., 3 months, 6 months, 1 year, etc.) market internals provide us with a picture of attitudes toward risk. Is the investment community favoring a pursuit of capital appreciation or is the community shifting toward risk aversion? The FTSE Multi-Asset Stock Hedge Index that I helped to create demonstrates that risk aversion has been in the driver’s seat for a while now, and that T.I.N.A. (“There Is No Alternative” to stocks) may not be as gorgeous as some have been portraying her.
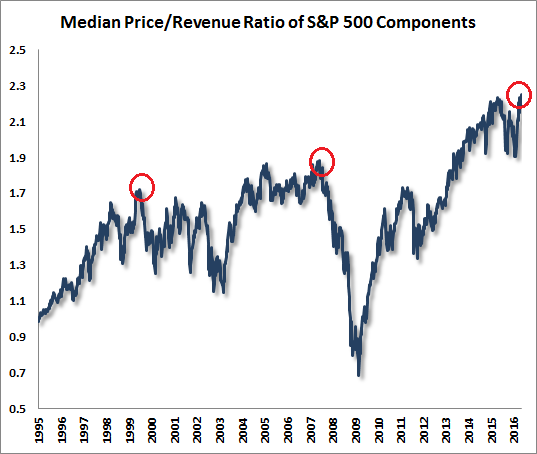
What’s more, longer-term valuation extremes may be ignored by complacent participants when indiscriminate risk taking is the name of the game. Conversely, when near-term risk aversion sets in, longer-term fundamental valuation does not get tossed out with the bath water. That is why there are reasons to be concerned about paying 2016 prices for 2012 profits; that is why it is problematic to see the median S&P 500 stock trading at the highest price-to-sales levels in history – higher than during the dot-com euphoria in 1999 and higher than the real estate bubble circa 2007.
Stock bulls are now hanging their collective hats on lower interest rates for much, much longer. Many rejoice at learning that the likelihood of a rate hike has been pushed all the way out to the first quarter of 2018. Not year-end 2016. Not anytime in 2017. Instead, Fed fund futures currently forecast a probable rate hike (50% or probability) occurring up to a year and a half from now.
Unfortunately, stock bulls are ignoring the risk-off positioning that has been taking place since the Fed ended quantitative easing in December of 2014. And while lower rates for longer may keep stocks range-bound, the policy also telegraphs just how weak the economy must be for the central bank of the United States to forgo rate normalization entirely.
Bottom line? Stocks are unlikely to gain genuine traction until the Fed creates more electronic dollar credits (i.e. “QE4″) such that the “more money” finds its way back into riskier assets once again.
Which stock should you buy in your very next trade?
AI computing powers are changing the stock market. Investing.com's ProPicks AI includes 6 winning stock portfolios chosen by our advanced AI. In 2024 alone, ProPicks AI identified 2 stocks that surged over 150%, 4 additional stocks that leaped over 30%, and 3 more that climbed over 25%. Which stock will be the next to soar?
Unlock ProPicks AI
