If the price that one pays for an asset is “fair” or “reasonable,” then one should not doubt having made the transaction. He/she might need to reevaluate whether the current price still reflects a reasonable value at a later date. After all, if a company’s share price has risen dramatically in relation to declining sales and falling profits, a former bargain may have turned into a bad deal.
Keep in mind, one could have owned an S&P 500 indexing vehicle when the benchmark traded for 1350 in June of 2012. What were the GAAP-based earnings per share at that time? $88.54. The price one paid four years ago in relation to profits, also known as the P/E or the “multiple,” was 15.3. That certainly qualified as fair or reasonable value on a historical basis.
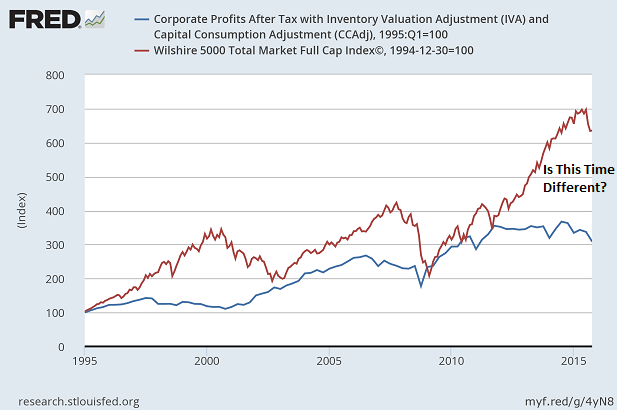
It is worth documenting that GAAP-based earnings per share have slumped from $106 at the conclusion of the third quarter in 2014 (9/30) to $86.4 in the first quarter of 2016 (3/31). Profits are actually lower than they were four years ago. And yet, price-insensitive buyers see no cause for concern in adding exposure to the S&P 500 at its current price of 2089 with a multiple of 24.2.
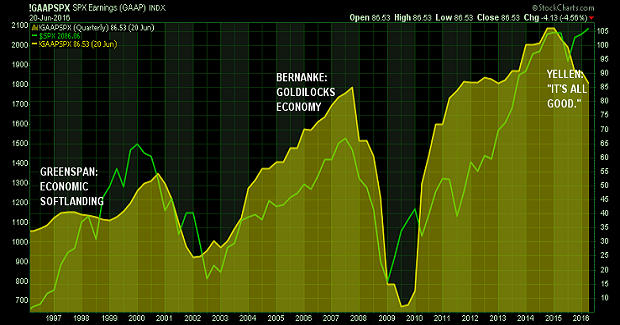
In the 20-year chart above, one can readily see the challenges that falling GAAP-based earnings present. When those earnings begin to deteriorate, they tend to continue doing so. It happened during the dot-com bust (2000-2002); it happened in the real estate collapse (2007-2009). Later or sooner, crumbling profits tend to weigh on major indexes.
So why are many of today’s investors demanding large-cap U.S. stock exposure, even at insanely overvalued P/E levels? One hypothesis is that ultra-low interest rates render traditional metrics irrelevant. “With a 10-year at 1.70% in June of 2016, you just gotta own stocks.”
If this speculative thought process actually had merit – if the idea that “there is no alternative” to stocks when bonds and cash yield so little had virtue – historical data would support the conjecture. On the contrary. Decision-making based on stock dividend yields or earnings yields as they relate to bond yields has led to awful investment outcomes.
Similarly, one can look back to the 10-year Treasury Rate four years ago. In June of 2012, the 10-year yield vacillated between 1.47% and 1.67%. The yield back then was even a bit lower than it is today. It follows that the interest rate angle is a complete wash. Roughly the same attractive borrowing costs existed four years earlier, and yet, today’s P/E would need to drop nearly 37% to approximate the fair value on S&P 500 stocks that existed in June of 2012.
Indeed, I have asked the question before: With respect to the S&P 500, why should investors pay 2016 prices for 2012 profits? In truth, I have yet to see a data-driven response to this question. What have I seen? A handful of emotional retorts and ill-conceived arguments that have nothing to do with the inquiry itself (e.g., “Market timing is stupid” or “There are lots of individual stocks that are fairly priced right now,” etc.).
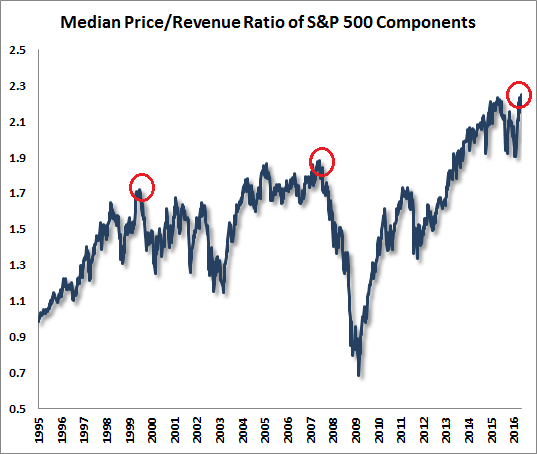
A similar question can be asked with respect to revenue. In the 20-year chart below, one can readily see that the median stock in the S&P 500 has never been as pricey. Not during dot-com tech euphoria. Not prior to the collapse of the domestic financial system. Never. Why, then, should investors be willing to pay the most exorbitant P/S in the history of the metric?
Note: If your answer is “low interest rates,” then you really need to revisit the 20-year period from 1936-1955. Interest rates were comparable to the current cycle, yet price-sales ratios for popular benchmarks were much lower. Moreover, the market still experienced four crushing bear markets.
What if the economy itself improves? Wouldn’t that mean better sales prospects for businesses? Wouldn’t that imply potential for enhanced profitability? And wouldn’t that likely lead to a meaningful increase in higher-paying jobs? Yes, yes, yes and yes.
Here’s the problem: There are few data points to support the notion of consequential economic improvement. Quite the opposite, in fact. The industrial sector – manufacturing, mining, utilities – continues to contract. Meanwhile, the Federal Reserve’s own Labor Market Conditions Index (LMCI) has rarely looked this poor outside of recession.
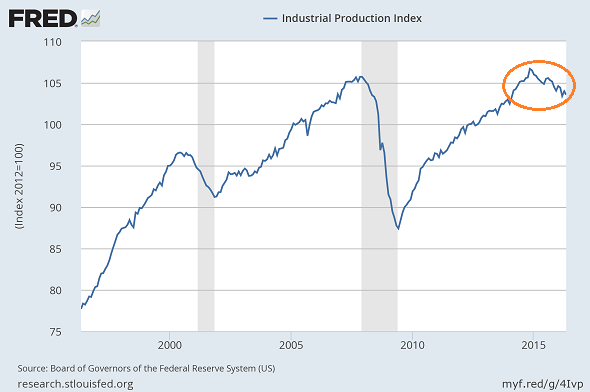
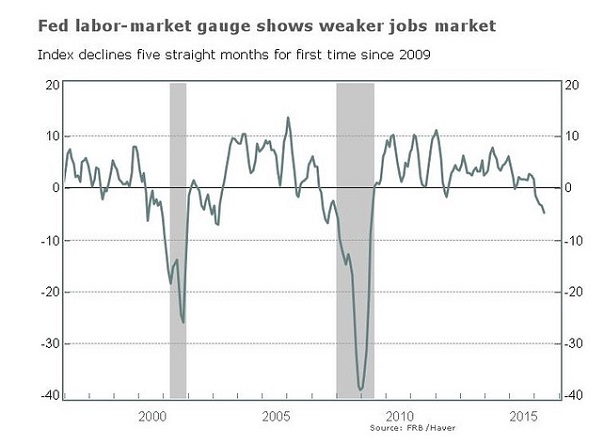
Let’s be candid. The Federal Reserve’s own “take” on the well-being of the U.S. economy has flipped 180 degrees. The Fed went into 2016 with an “intention” of raising overnight lending rates on four occasions. They slashed that fantasy down to two rate hikes for 2016 shortly after anemic 1st quarter data began pouring in.
By the time the May payrolls came around, the consensus fell to a singular bump higher or zero moves in 2016. Voting Fed member James Bullard went so far as to downgrade the U.S. economy’s potential over the next 30 months, stating that there may only be one rate bump higher between now and year-end 2018. Unbelievable!
The bullish belief is that “lower for much, much longer” is a wonderful tailwind for stocks. Me? Endless central bank manipulation has caused excesses in debt at all levels (i.e., household, corporate, state and federal government, etc.) as well as asset price insensitivity that gives the cold shoulder to rational analysis.
Disclosure: Gary Gordon, MS, CFP is the president of Pacific Park Financial, Inc., a Registered Investment Adviser with the SEC. Gary Gordon, Pacific Park Financial, Inc, and/or its clients June hold positions in the ETFs, mutual funds, and/or any investment asset mentioned above. The commentary does not constitute individualized investment advice. The opinions offered herein are not personalized recommendations to buy, sell or hold securities. At times, issuers of exchange-traded products compensate Pacific Park Financial, Inc. or its subsidiaries for advertising at the ETF Expert web site. ETF Expert content is created independently of any advertising relationships.
