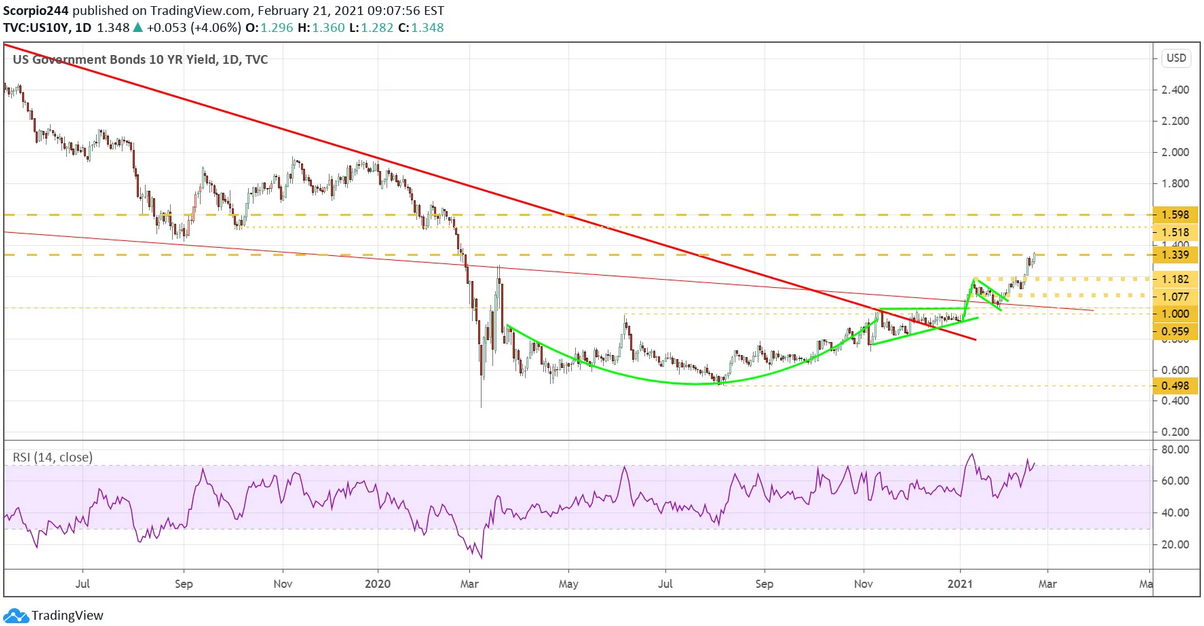
Rates will likely be all of the focus this week, especially after the big move higher last week across the yield curve. The 10-year jumped to finish last week around 1.35%, while the 30-year closed at 2.13%. It seems possible these rates are likely only to rise further, especially after the Fed minutes last week revealed that the Fed’s interruption of inflation is likely to be very different than what the market’s view is.
10-Year Treasuries
As I noted in my 10 predictions for 2021, I thought the 10-year could rise to around 1.5% in the first half of the year on the “illusion” of higher inflation rates. So far, I am sticking with that call, and with just 15 bps to go, I will have to think about whether that prediction was too low.
The next big level I am expecting on the 10-year will come at 1.51%.
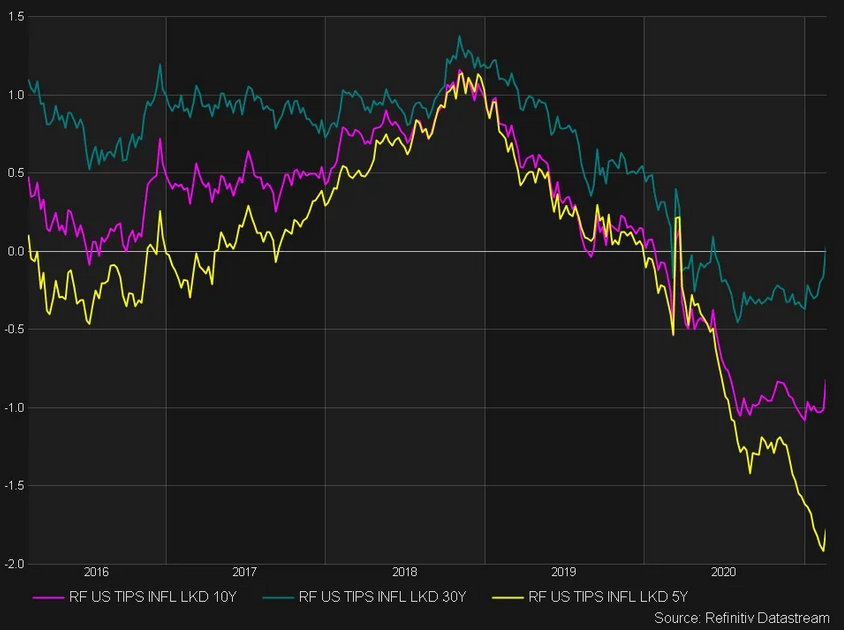
But the big story last week was the big break high in real rates, also known as TIPS. The 10-year TIPS saw its rate rise to -81 bps, while the 30-year TIP rose to +3 bps. Huge moves last week.
10-Year TIP
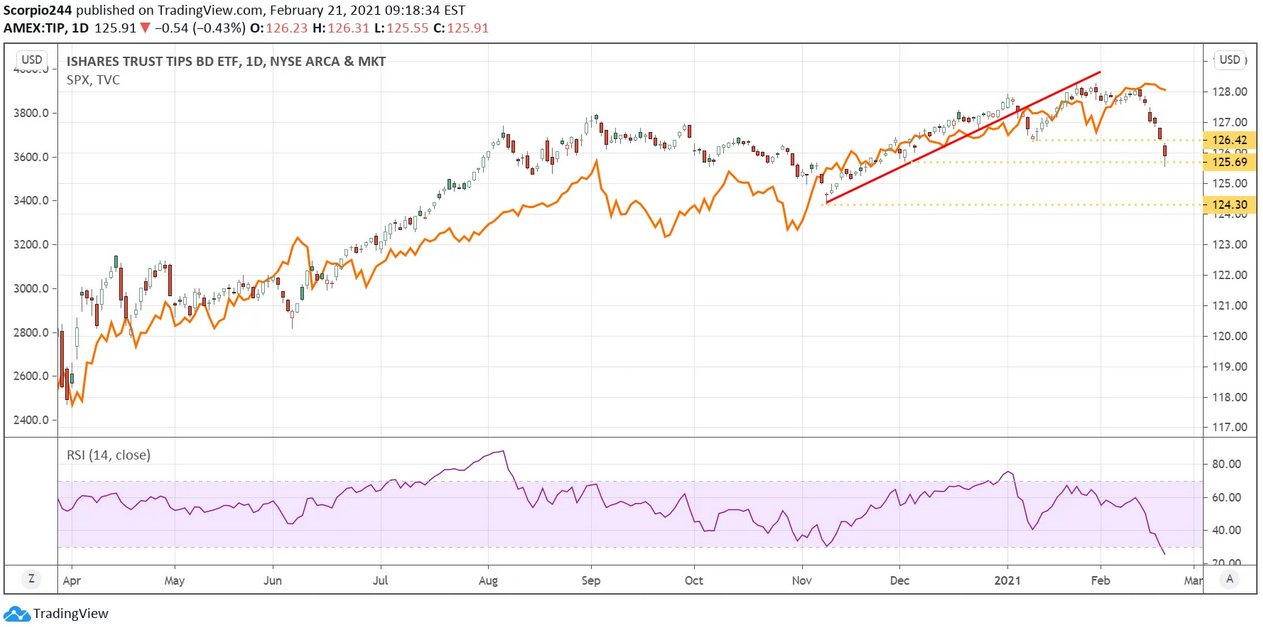
It led to a rather big breakdown in the TIPS Bond ETF, which is the best way to easily follow the TIP market. For now, the TIP ETF found some support at $125.70, but I do not expect that to last, and I see the TIP ETF falling $124.30 in the weeks ahead.
S&P 500
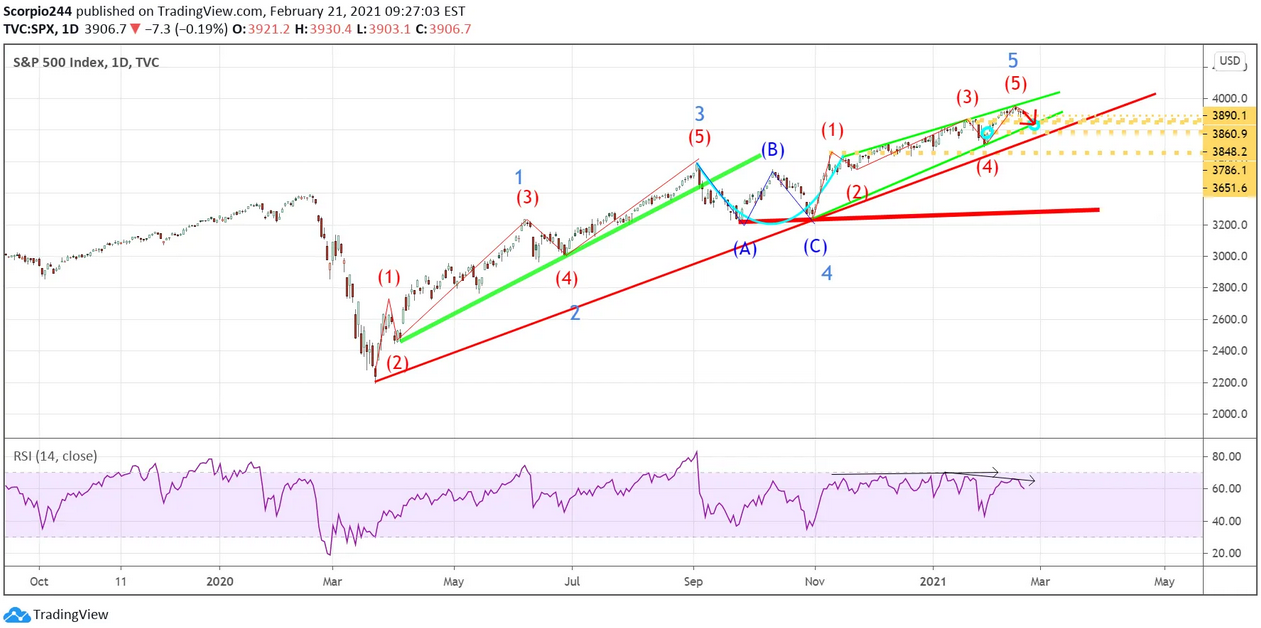
I still believe the S&P 500 index is likely heading back to support at roughly 3,780.
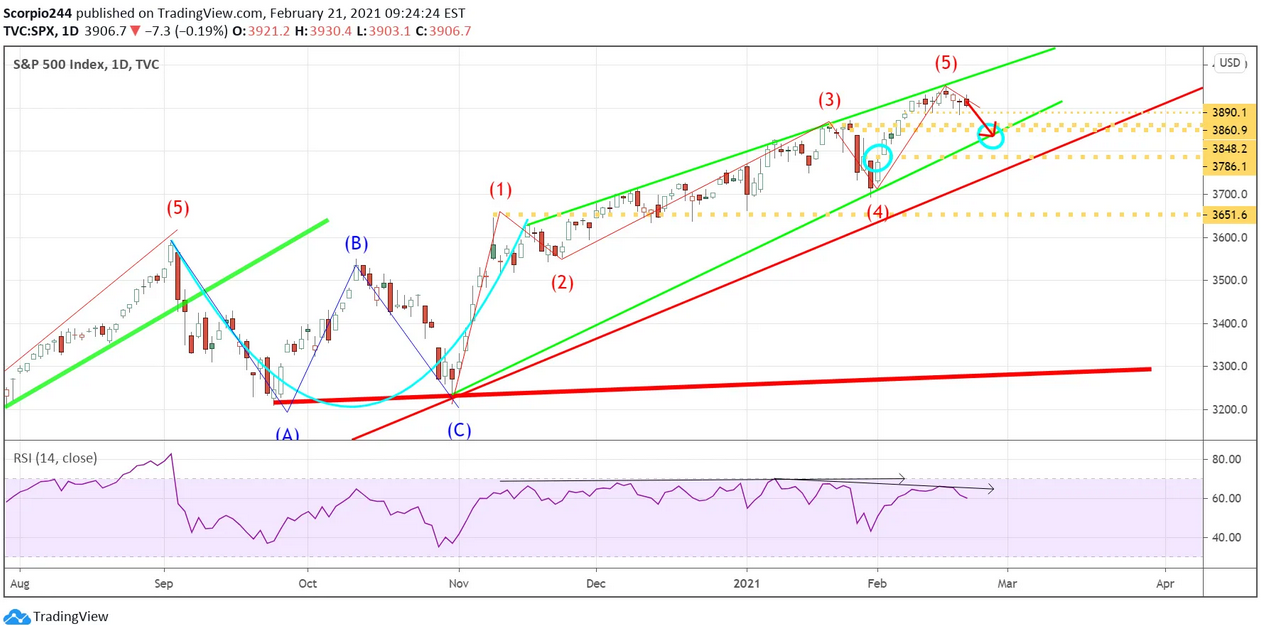
It could also mark the top of this leg higher in the index off of the March 2020 lows.
Tesla
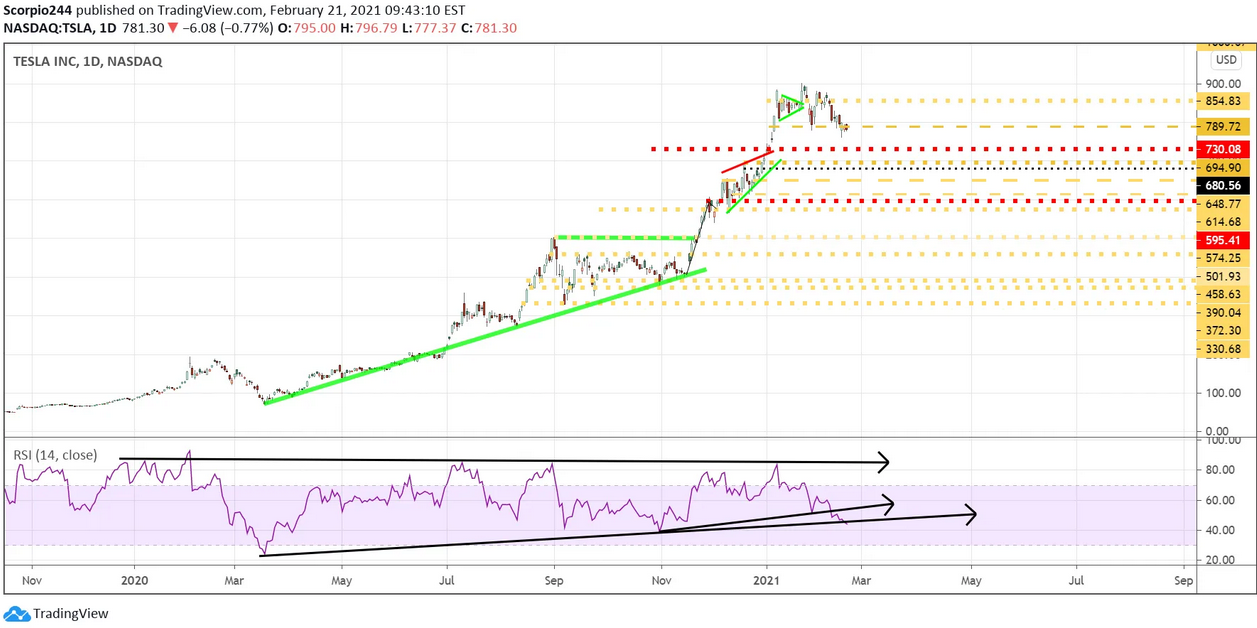
Tesla (NASDAQ:TSLA) is at a critical inflection level with the RSI on a big uptrend that dates back to the March lows. If the RSI uptrend breaks, it will indicate a major change in the trend and likely lower prices to follow. The stock has been hovering around support at $790, with the next major level at $730.
Uber
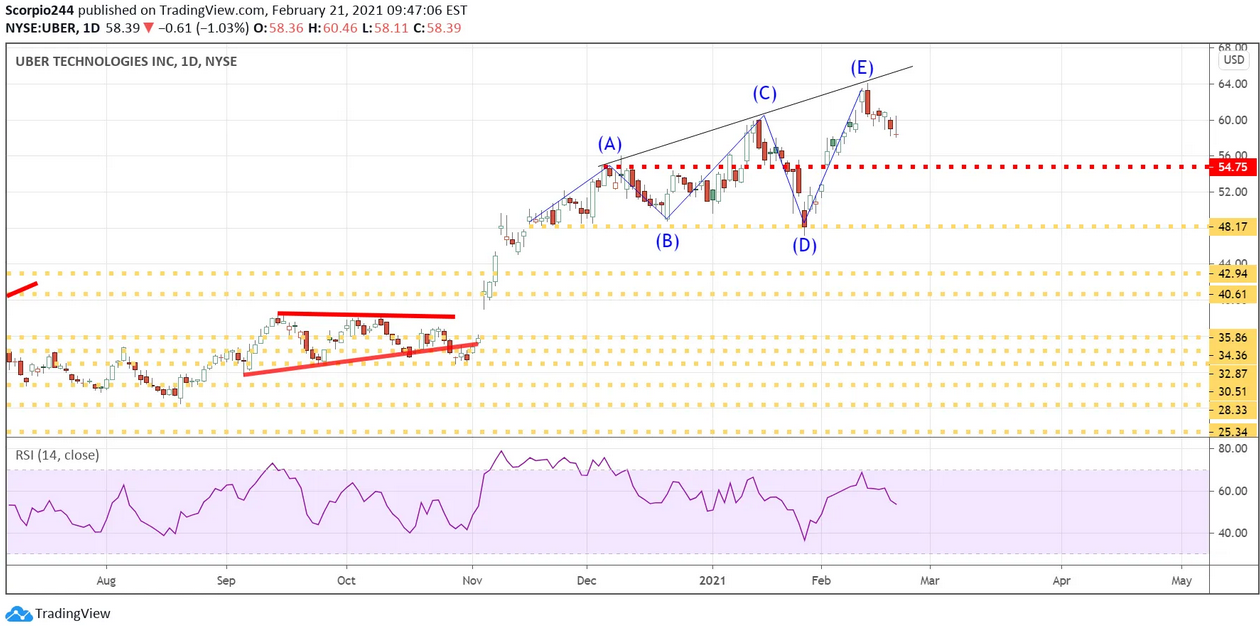
I can’t understand why Uber (NYSE:UBER) has surged the way it has, and the count would seem to suggest the run-up higher is over, with the next level I am still looking for coming down at $54.75 and perhaps lower at $48.20.
Bank of America
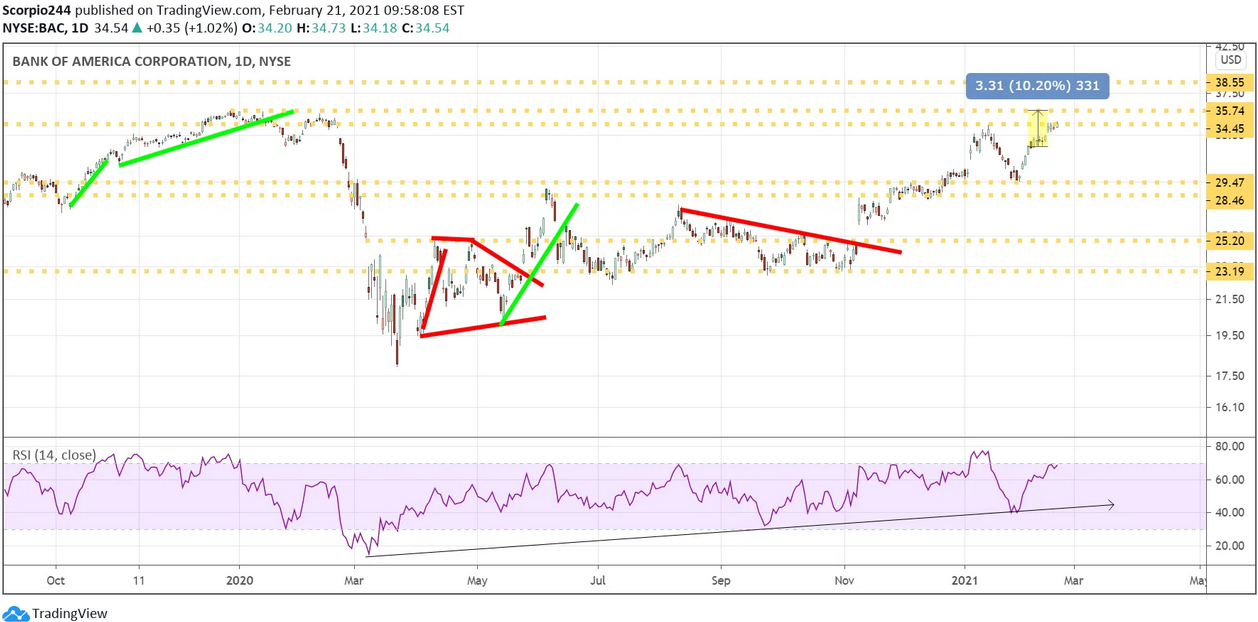
Bank of America (NYSE:BAC) is likely to continue to do well as long as rates stay at current levels or higher, resulting in the stock rising to around $35.75.
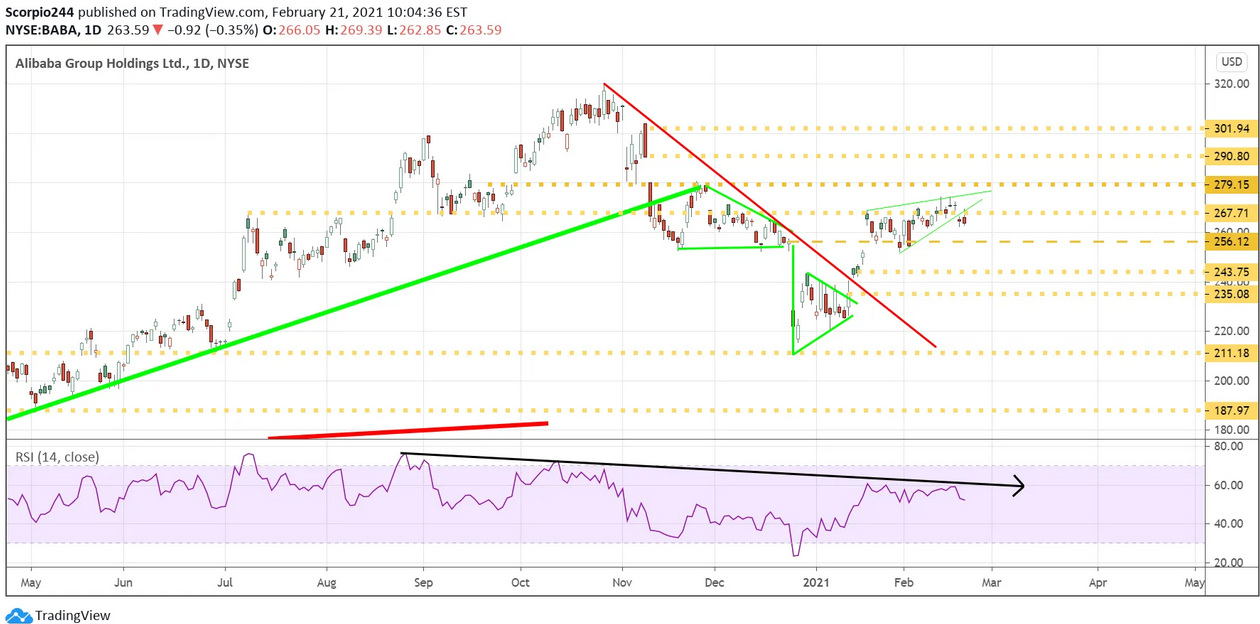
Alibaba
Last we will look at Alibaba (NYSE:BABA), which has struggled at resistance around $270. The RSI trend suggests lower prices lie ahead, with the stock’s potential to fall back to $256.
Have a good week.
