🤯 Have you seen our AI stock pickers’ 2024 results? 84.62%! Grab November’s list now.Pick Stocks with AI

World Market 'Buy' Signal Triggered, S&P 500 Soon To Follow

Published 07/16/2017, 01:14 AM
Updated 07/09/2023, 06:31 AM
US500
-
XLB
-
XLY
-
XLE
-
XLI
-
XLP
-
XLV
-
VIX
-
XLK
-
XLU
-
MIWO00000PUS
-

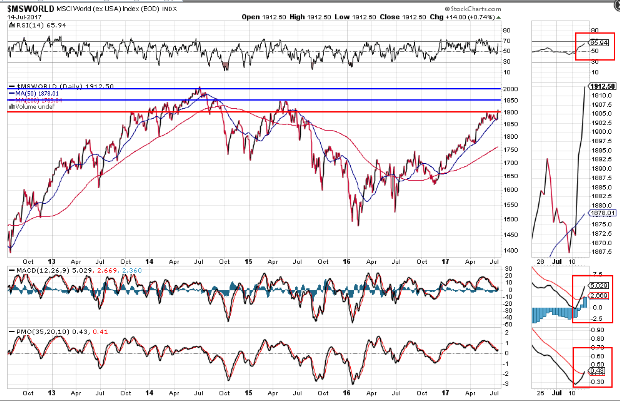
A new "BUY" signal has just triggered on the World Market Index. I last wrote about this index on June 29th.

Price punched through 1900 (which will now need to hold as major support), the RSI has broken its latest downtrend and is back above 50, and there are new bullish crossovers on the MACD and PMO indicators, as shown on the following Daily chart.
MSWORLD Daily Chart

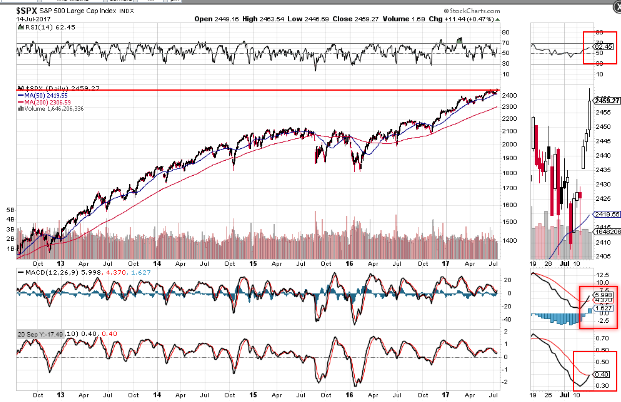
While the SPX has broken above near-term resistance of 2450 and closed at another all-time high, it's a nano-breath away from also triggering a new "BUY" signal.

If price remains above 2450, if the RSI remains above 50, if the recent bullish crossover holds on the MACD, and if we get a bullish crossover on the PMO (imminent), we'll see this trigger erupt, as shown on the Daily Chart below.
SPX Daily Chart
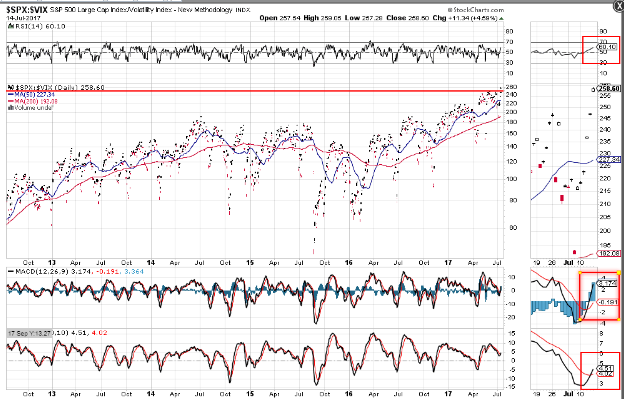
The SPX:VIX ratio has also broken above near-term resistance of 250 and closed at a new all-time high, as shown on the Daily ratio chart below.

Inasmuch as the RSI has broken its downtrend and is above 50, and bullish crossovers have formed on the MACD and PMO indicators, this ratio is confirming that a new "BUY" signal has triggered on the SPX. However, to see this through to fruition, we'll need to see price remain above 250 and volatility remain at all-time lows.
SPX/VIX Daily Chart

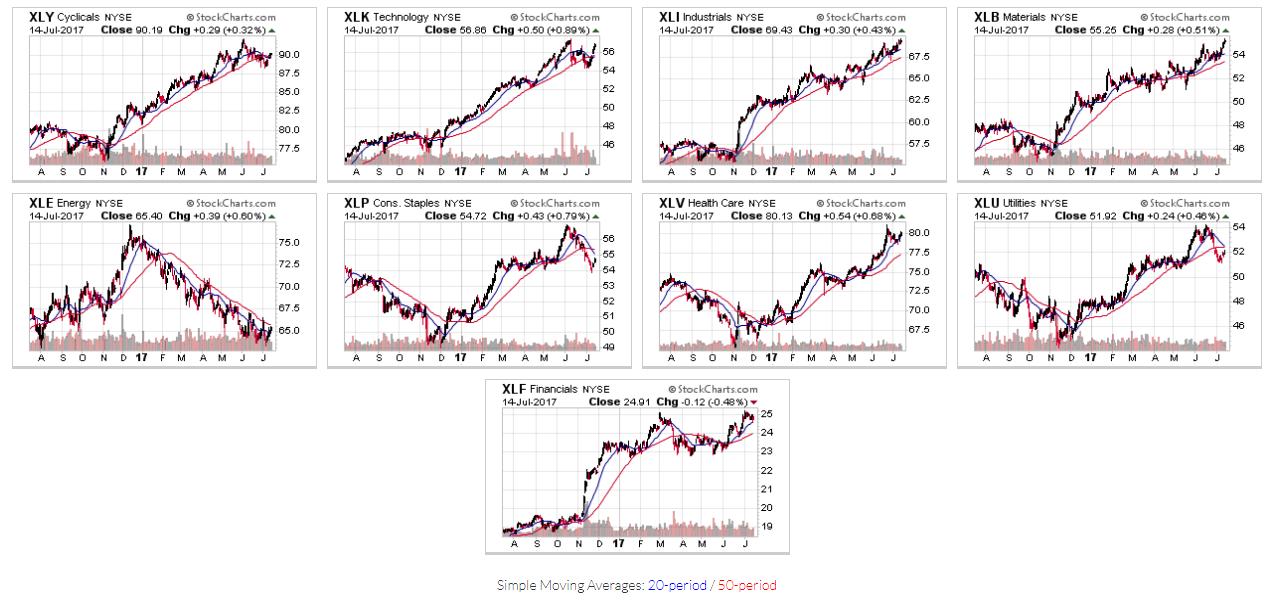
The following 1-Year Daily chart grid of the 9 Major Sectors shows that Industrials and Materials are leading the pack, followed closely by Technology, Healthcare, Cyclicals and Financials.

Utilities and Consumer Staples have slumped the past couple of months and Energy has been in a major downtrend all year. I'd keep a close watch on these three sectors to see if buyers begin to dip their toes into these anytime soon.

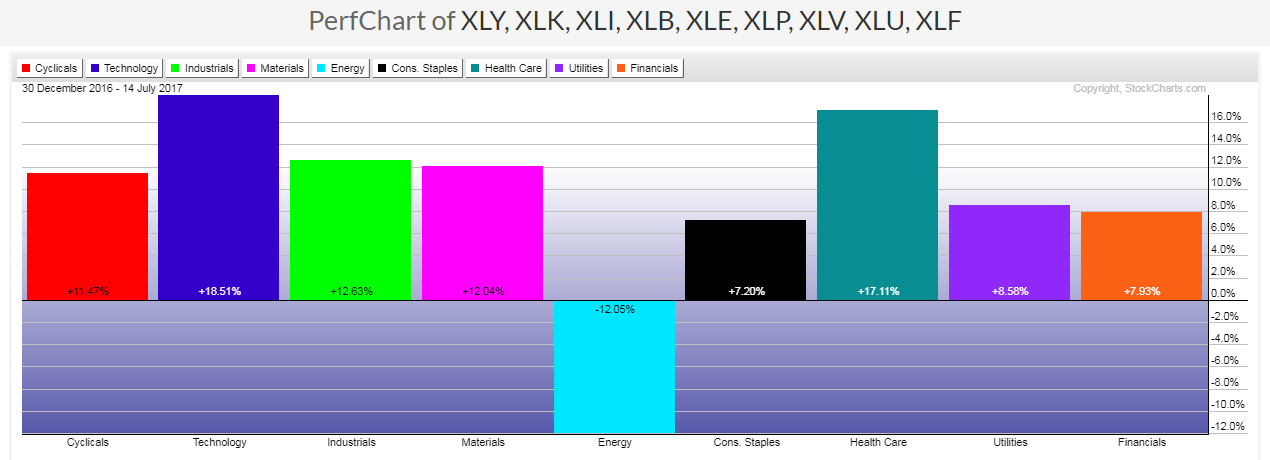
If so, and, if the other six sectors can hold their own, we will, no doubt, see more new records set in the SPX, with buying continuing in the World Market Index (the Year-to-date graph below shows that 8 of the 9 sectors have decent to healthy gains, so far this year, while Energy is at -12.05%).
Sector Chart Grid 1-Y Daily
YTD Sector Performance

Latest comments

Loading next article…
Risk Disclosure: Trading in financial instruments and/or cryptocurrencies involves high risks including the risk of losing some, or all, of your investment amount, and may not be suitable for all investors. Prices of cryptocurrencies are extremely volatile and may be affected by external factors such as financial, regulatory or political events. Trading on margin increases the financial risks.
Before deciding to trade in financial instrument or cryptocurrencies you should be fully informed of the risks and costs associated with trading the financial markets, carefully consider your investment objectives, level of experience, and risk appetite, and seek professional advice where needed.
Fusion Media would like to remind you that the data contained in this website is not necessarily real-time nor accurate. The data and prices on the website are not necessarily provided by any market or exchange, but may be provided by market makers, and so prices may not be accurate and may differ from the actual price at any given market, meaning prices are indicative and not appropriate for trading purposes. Fusion Media and any provider of the data contained in this website will not accept liability for any loss or damage as a result of your trading, or your reliance on the information contained within this website.
It is prohibited to use, store, reproduce, display, modify, transmit or distribute the data contained in this website without the explicit prior written permission of Fusion Media and/or the data provider. All intellectual property rights are reserved by the providers and/or the exchange providing the data contained in this website.
Fusion Media may be compensated by the advertisers that appear on the website, based on your interaction with the advertisements or advertisers.
© 2007-2024 - Fusion Media Limited. All Rights Reserved.