2020-2022 What will happen to the World Indices, A US Constitutional Crisis or Something Else?
The market move by Technical sequences, levels, and areas. Every day we see how the price moves from one area to another and relates the time frames from Subminutte cycles to the Grand Super cycles. The Idea is relating the degrees and creating sequences in each time frame in an impulse nature of 5-9-13 or corrective in 3-7-11. We track over 80 instruments at Elliottwave-Forecast and we related them then divided in groups each day.
We understand the nature of the Market and we knew back in 2017, that in 2018 the World Indices will be ending a Cycle degree and another cycle degree will start and run into the 2020-2022 period when many cycles will reach the 100% extreme areas within the Grand Super cycle and also reach the time 100% extension within the Super cycle degree. The World Indices are running a Grand Super Cycle in which the SPX and INDU have reached the 100% and trading within a Blue Box, which in our system mean the extreme areas have been reached and as far as below the 1.618% extreme most of the time a cycle will end. We see many Indices like FTSE, NIKKEI, DAX all needing an extension within the super cycle which started in 2009.
As we mention before, we believe the Market is completed Technical, but for years we understand that something always happens to justify the move and we are afraid that this time around we need to be something bigger.
The reason for this is because the correction in 2000-2009 in World Indices was a Gran super cycle correction and was justified by the Housing crisis which indeed many World Indices were at the same stage which we will be in 2020-2022 area, the big difference is that in 2 years we will be in a double degree Grand Super cycle, which make the same degree as 2000-2009, but double in size. Consequently, we are trying to find in the future which event can be taking place at that time. Looking ahead, we got The US presidential election in 2020, maybe a Constitutional crisis, maybe a huge conflict around the World will take place, we know and understand something big needs to happen because something will need to justify the biggest correction, we have ever seen.
NIKKEI Super cycle degree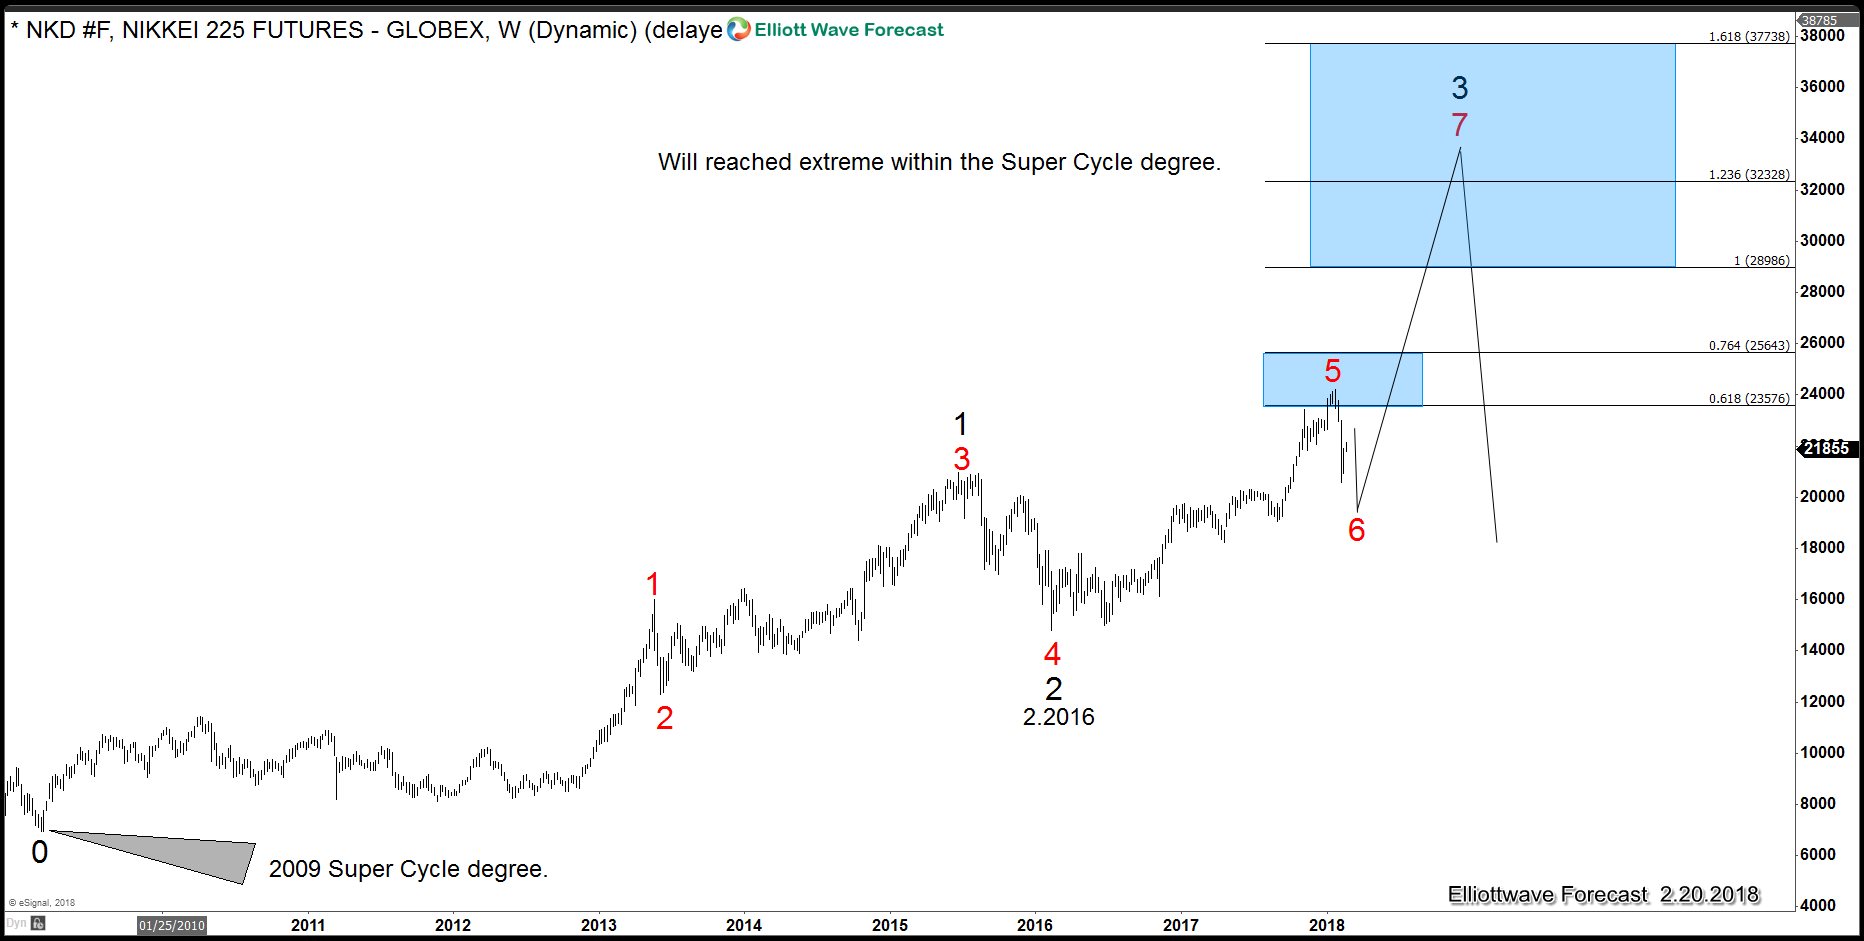
The Index like every World Index started a Super cycle degree in 2009, from there the Index ended a cycle degree at 2015 and started another one in 2016, Index just finished a Primary cycle degree and should do another one which should take 2 or more years, we labeled as RED 7, then will see 7 REDS and 3 BLACKS which can provided the biggest declined since 2009 minimum.
NIKKEI Super Cycle in Time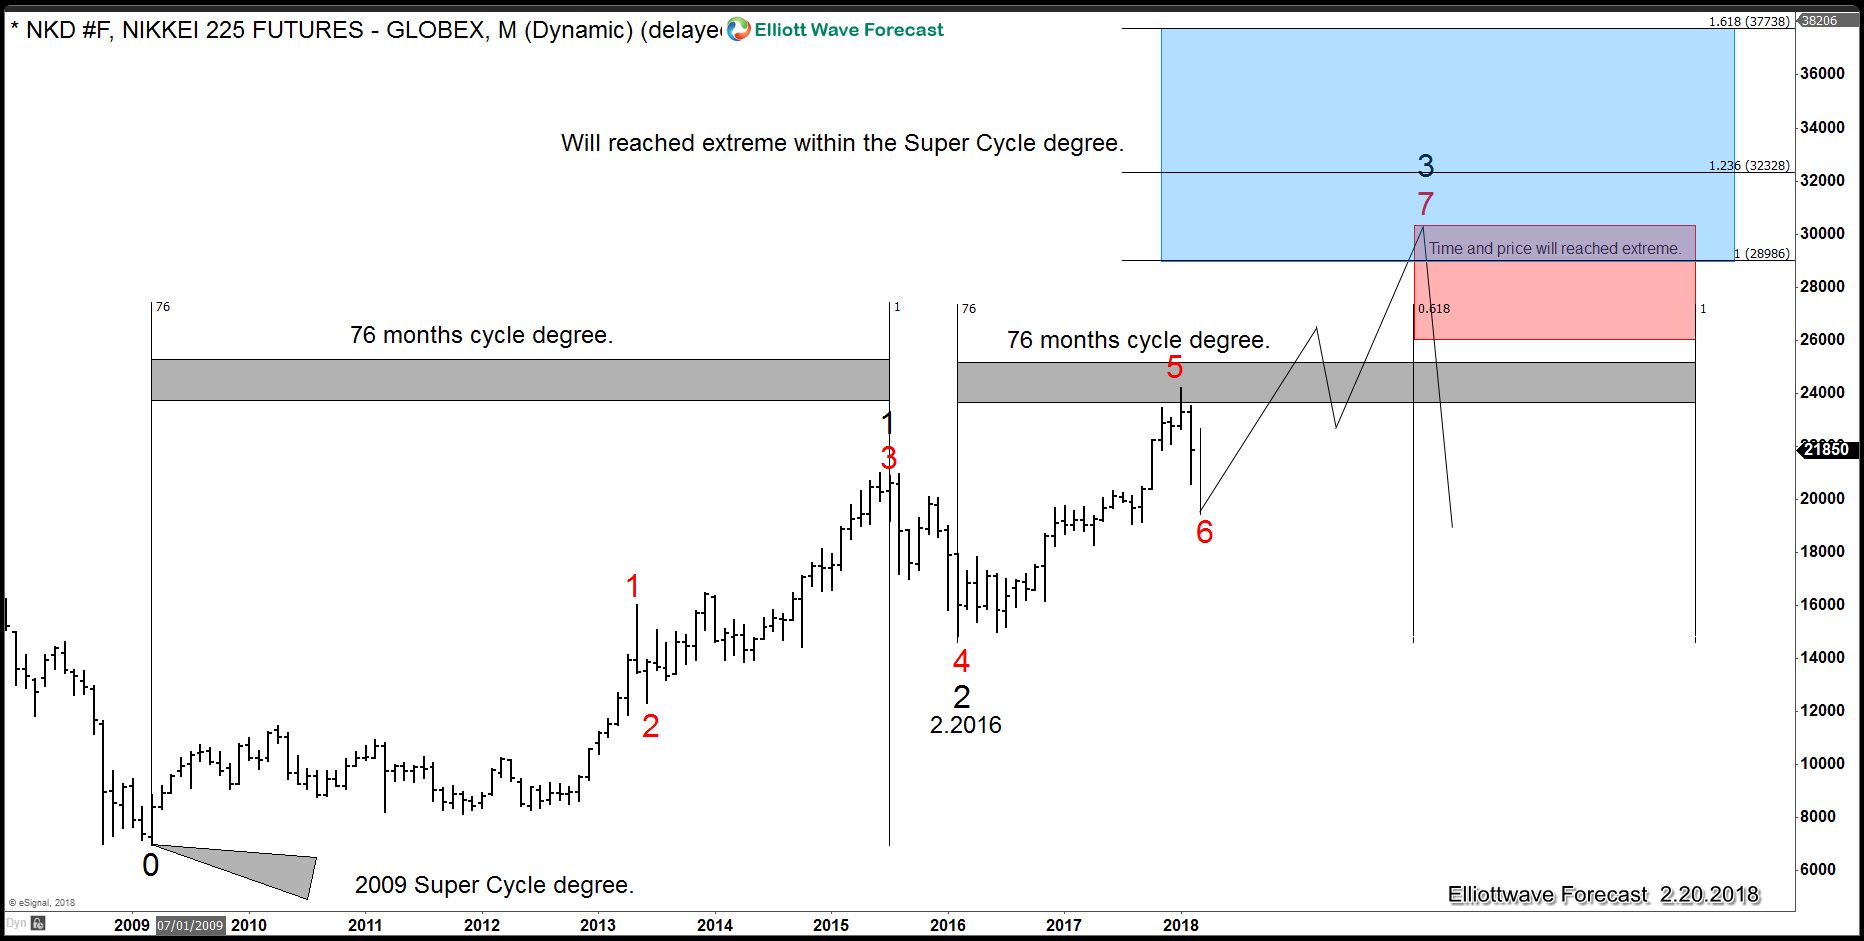
The above chart show 2 cycles degree which will be equal in time and price by 2020-2022.
FTSE Super cycle degree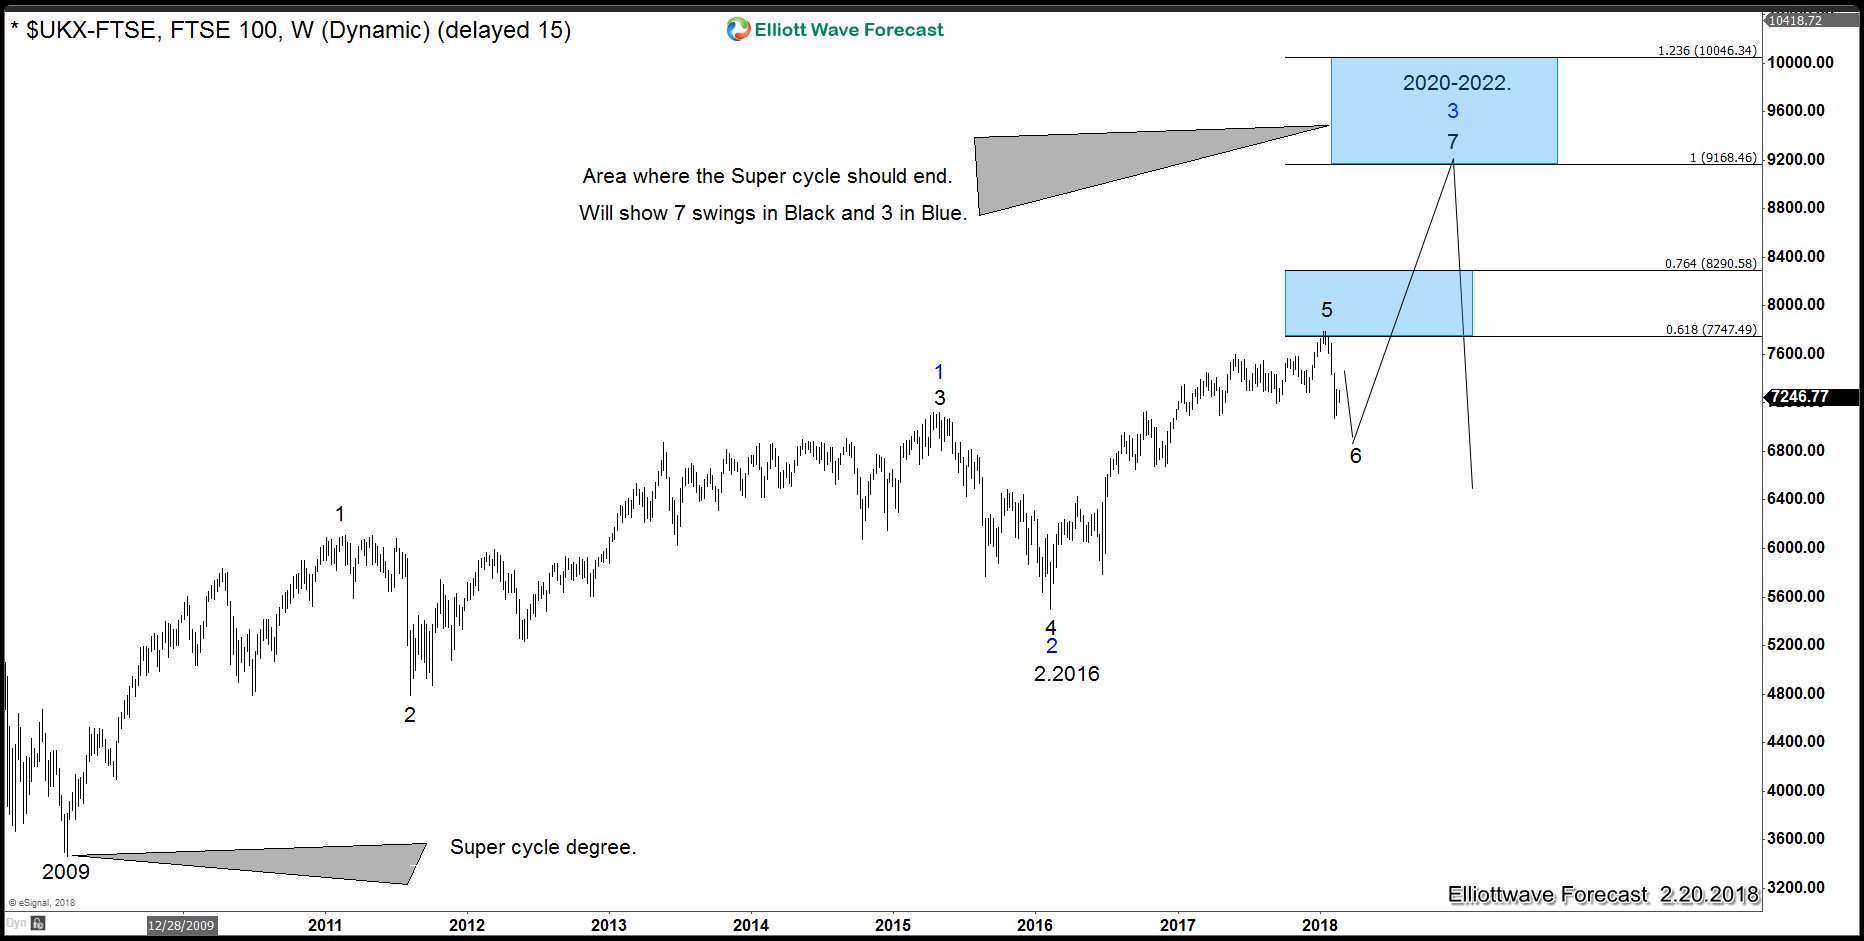
The Index is showing the same degree and cycle as $NIKKEI and we should see another leg higher into the 3 BLUE and 7 BLACKS which should end the cycle from 2009 low, the sequence is the same as $NIKKEI and most World Indices.
FTSE Grand Super cycle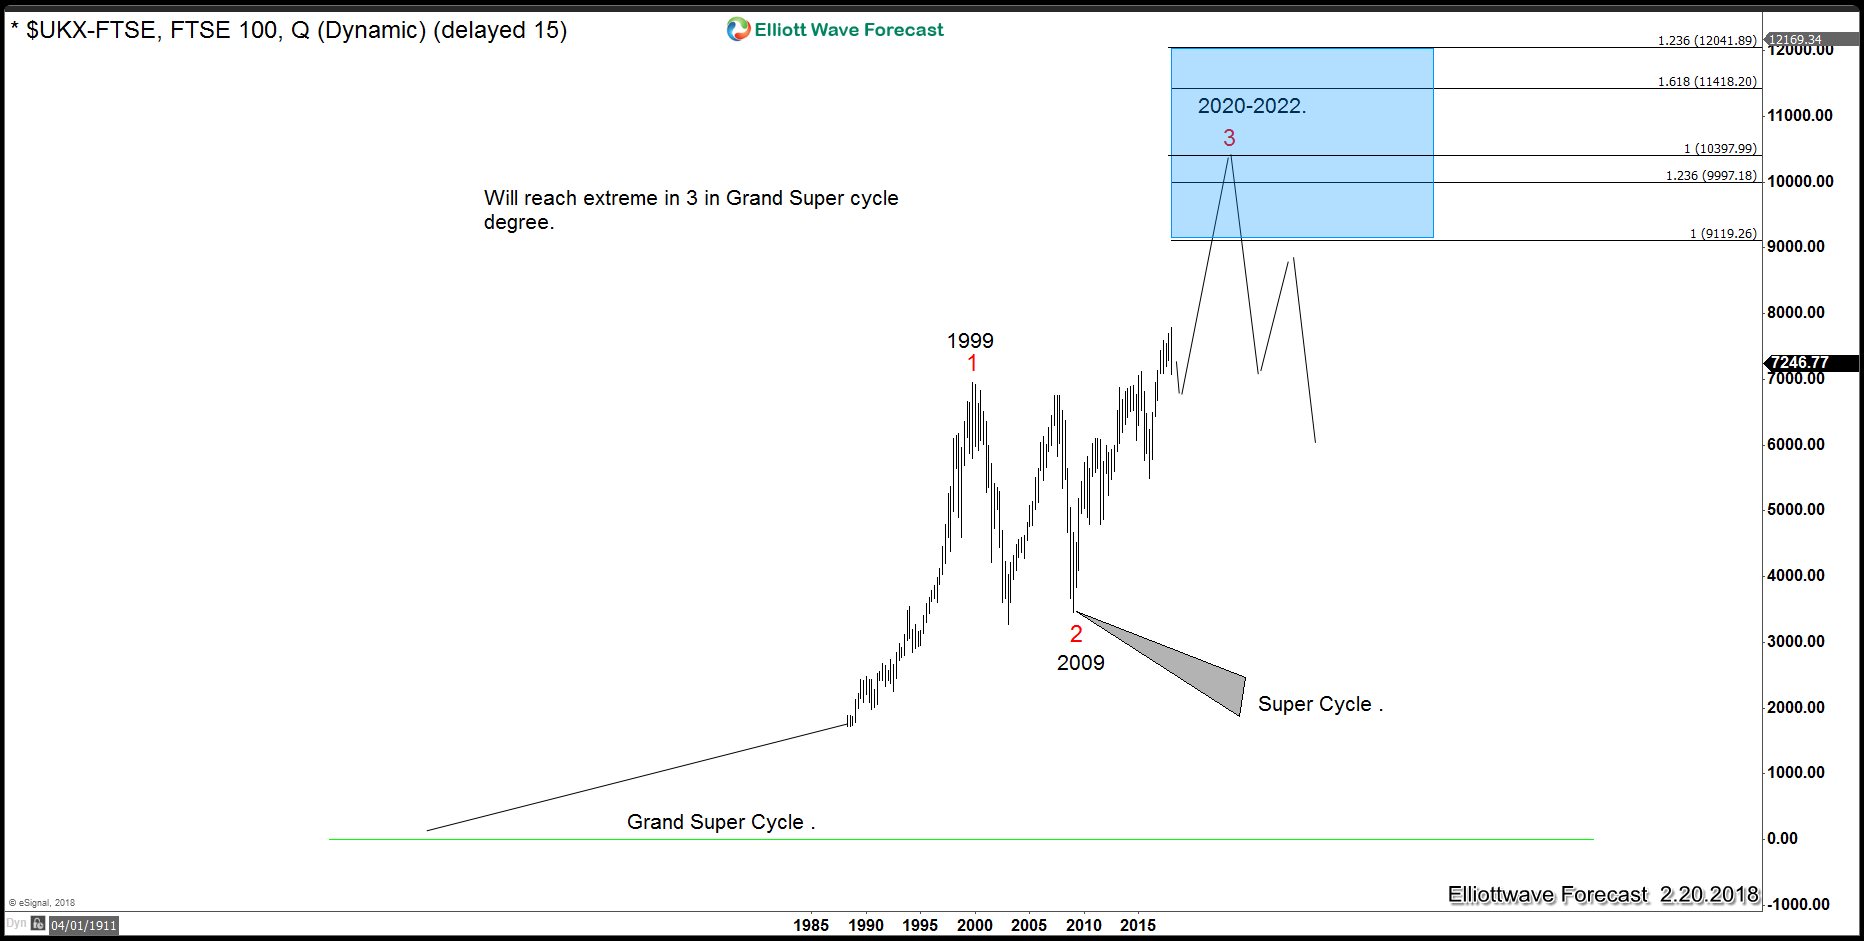
The Index is showing a higher degree possible extreme situation by 2020-2022 and not only can be ending the Super Cycle, but also a Grand Super Cycle.
FTSE Super Cycle in Time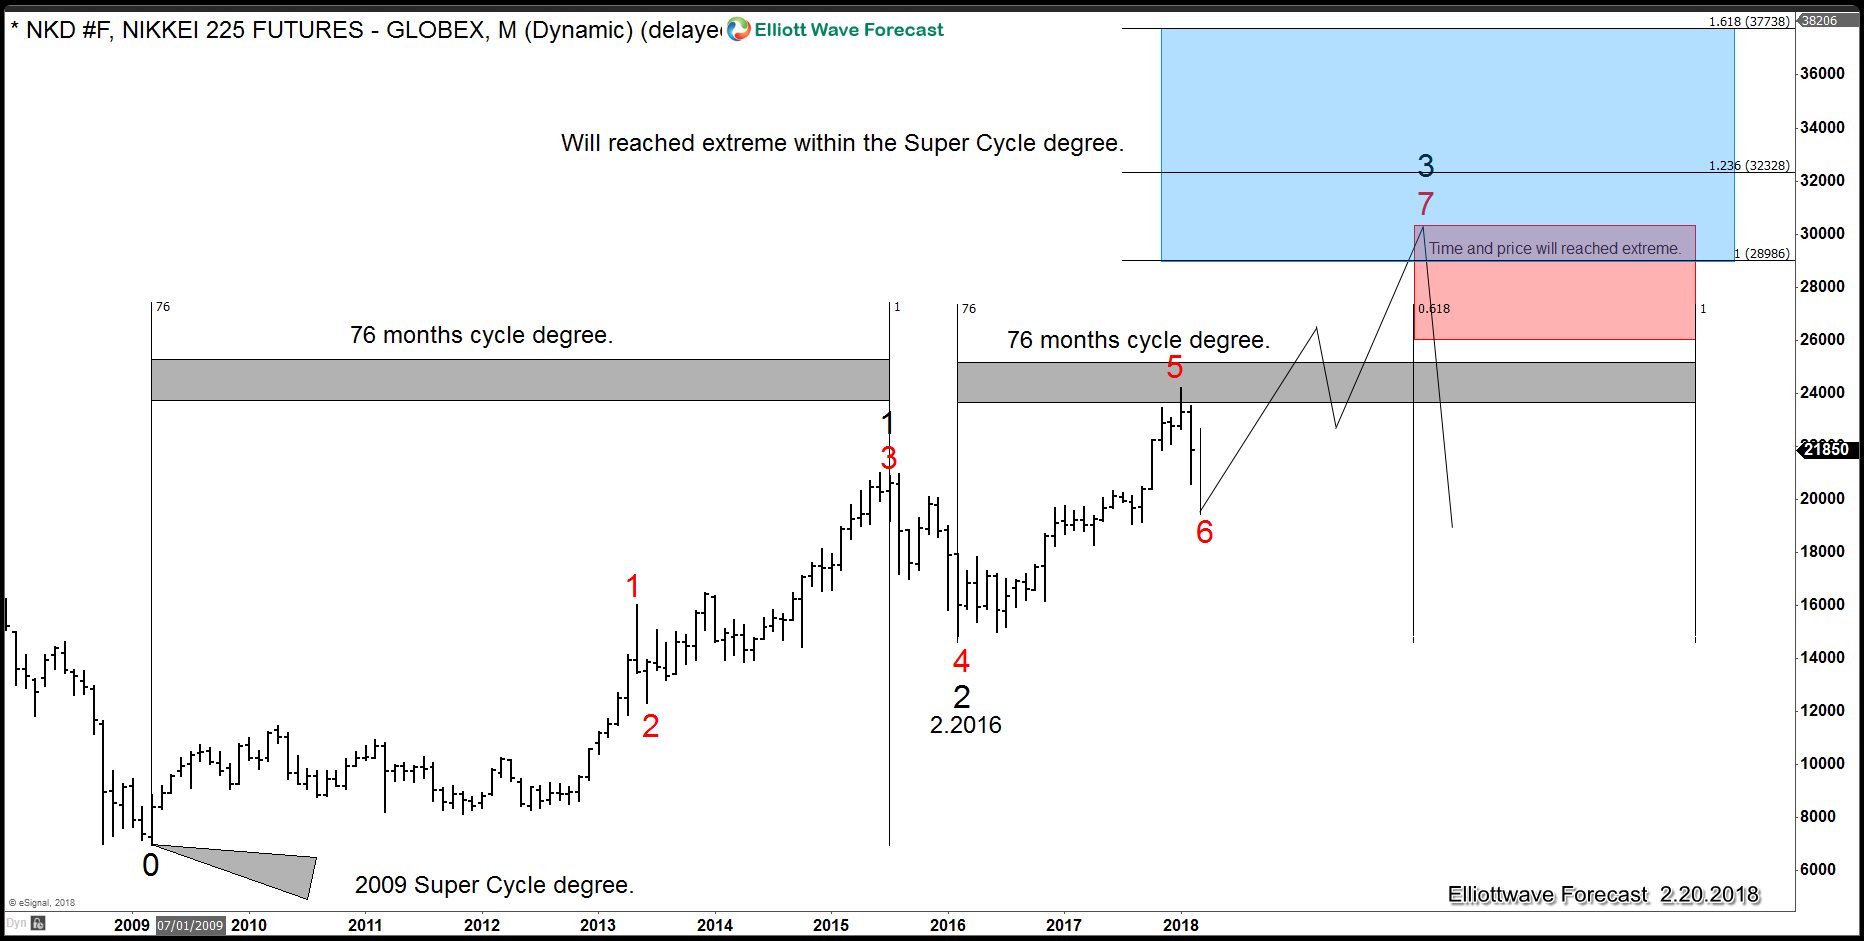
Index is showing the same time sequences and cycles as many world Indices and 2020-2022 will align Time and price.
SPX Time and Price Super Cycle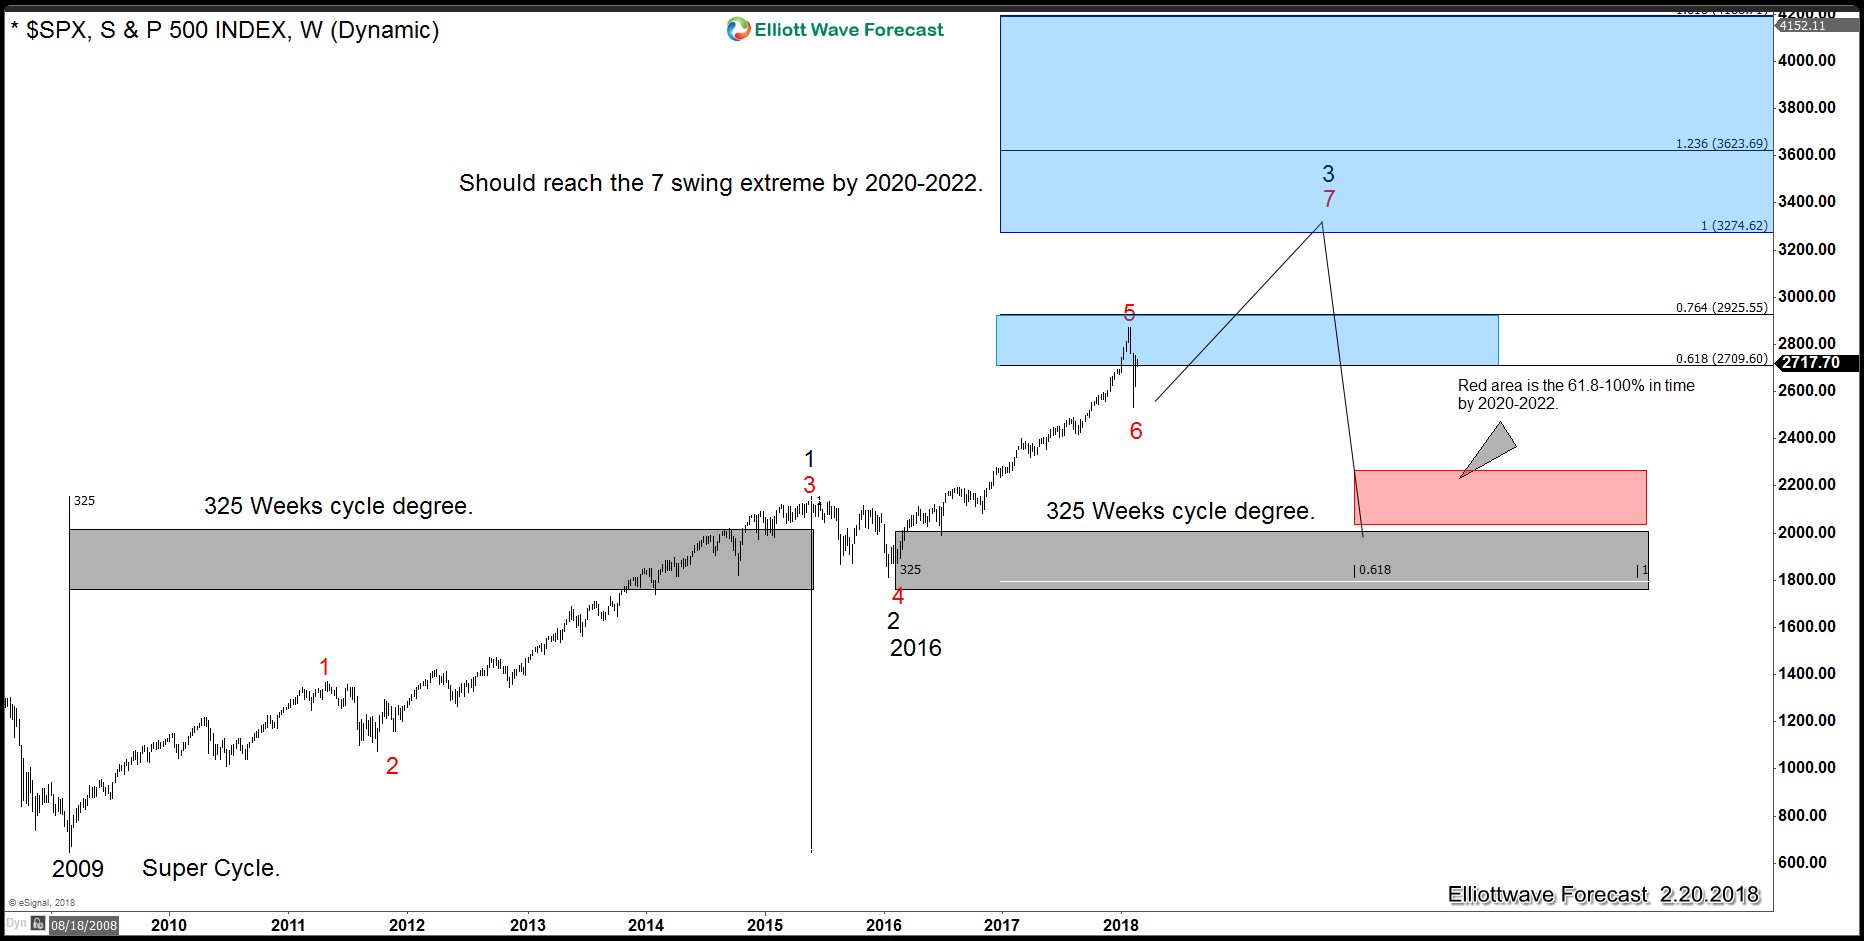
The Index like every other World Indices is showing a Super cycle since lows at 2009 and related to 2016, the price target will be 3274 and time should be around 2020-2022.
Every World index shows the same degree in price and time, as always we believe in the one Market concept, but we also believe when the Market reaches those areas, some event will happen around the World to manipulate the crowd and created the illusion the even created the correction when it is otherwise.
