
Markets have been bleeding tremendously over the past few days. Yesterday's murderous trading session ended with the S&P 500 and Nasdaq plunging 3% and 2.96% respectively.
A total of $907b was wiped off the Nasdaq, and the S&P 500 saw its largest drop since the rate-hiking spree in September 2022. Large-cap powerhouses like Apple (NASDAQ:AAPL), Microsoft (NASDAQ:MSFT) and Nvidia (NASDAQ:NVDA), amongst others, also tanked significantly.
The blood in the markets can be attributed to a few key reasons.
A Potential End to the Yen Carry Trade
The Japanese yen has been known to be one of the most lucrative currencies for carry-trading. Due to near-zero interest rates as a result of Japan's expansionary monetary policy, investors have been borrowing the Yen and using the borrowed funds to invest in higher-yield instruments like treasuries and stocks.
However, things took a turn since the Bank of Japan increased the policy interest rate to 0.25% and announced that it would reduce the pace of government bond purchases. In addition, Bank of Japan chief Kazuo Ueda signalled that an additional rate hike may come in the near future.
This piece of news has sent shockwaves among Yen carry traders, who now face significantly higher borrowing cost. To make matters worse, the US dollar has plunged to a 4-month low after last week's disappointing employment figures.
As the Yen grows stronger and the dollar gets weaker, this spells double trouble for Yen carry traders investing in the US market, as the USD/JPY pair is now tipping closer than ever in favour of the Yen.
The above, which can be obtained from Investing.com's live currency pair charts, shows a steep plunge in the well-known USD/JPY currency pair — indicating that much lesser Yen is required to purchase a US dollar now.
The implications of this cannot be understated, as Yen borrowers who have bought dollar-denominated instruments now not only face higher borrowing costs, but also a much weaker exchange rate since their dollars can now buy significantly less Yen as compared to a few months ago.
As a result, these carry traders are starting to divest to lock-in their profits or reduce their losses, which has contributed significantly to the market meltdown over the past few days.
Worrying Recession Indicators
Fears of an impending recession have emerged once again among retail and institutional investors, and a few well-known indicators certainly point towards this direction.
Firstly, the Buffett Indicator, which compares US market capitalisation to the country's GDP, flirted with the 200% level in late July.
Warren Buffett himself has stated that one should be concerned when this indicator nears 200%, and it has been shown historically that significant market correction likely follows as a consequence.
Secondly, the Sahm recession indicator, which compares the 3-month moving average unemployment rate with the lowest point of the 12-month unemployment rate, also points towards a potentially falling market based on what is known by many economists as the Sahm rule — stating that we are approaching or already in early months of recession if the 3-month moving average unemployment rate is 0.5% or more above the 12-month low.
The Sahm rule was triggered about 4 days ago after Friday's jobs report, and there has been strong debate over whether the weak employment data is an indicator of an impending recession.
While we cannot say for sure that the recession is certain, the triggering of these historically accurate indicators have definitely spread fear among multiple investors, who are moving money out of the stock market and into investment-grade fixed income instruments.
The Bursting of a Possible Bubble
Apart from carry trade matters and recession cries, we also see the slow bursting of a potential bubble that has built up over the past year.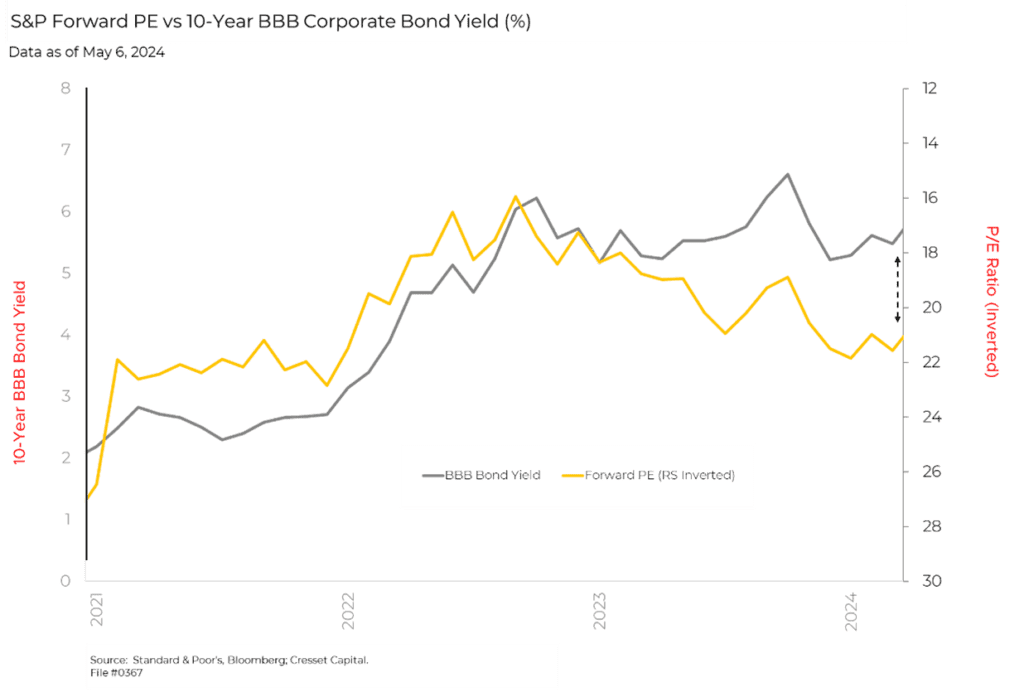
We refer to the chart above, which compares the forward estimate of the S&P 500's earnings yield with the 10-year BBB corporate bond yield. We see that just a couple of months ago, the inverted forward PE of the S&P 500 was over a percentage lesser than corporate bond yields — the former was at 4.8% and the latter, 5.9%.
The yield gap at that time signalled an overvaluation of the S&P 500 of about 20%, largely contributed by the tech sector boom and the consequent valuation surges of the "Magnificent Seven" companies.
Fast forward to now, the plunge in market indices and tech-focused large caps could be partly attributed to a mass correction of company valuations in the tech sector.
Do you Need to Panic?
While the market is bleeding profusely, it's no indication that you should exit all your positions and be ready for the next episode of the Dot-com bubble. It's difficult to predict when the market will bottom out.
In addition, we're dealing with a very different economy now as compared to the era of the Dot-com bubble and the global financial crisis, so nobody really knows how this will play out in the next few years.
That being said, there are still ways for investors to benefit from the situation. Fear in the market often presents lucrative buying opportunities, as strong companies begin trading at more attractive valuations. Continuously dollar-cost-averaging into such companies or funds containing them remains a sound strategy in such market conditions.
Increased market volatility also means higher potential profit from options trading or general day trading if proper strategies are implemented to manage your risk. All in all, it's better to focus on how the situation can be tweaked in your favour, rather than to panic over your current positions.