That’s the $64,000 question today: will S&P 500 earnings hit their trough with the Q1 ’19 earnings reports set to start in the next two weeks?
Prior to last year’s distortion of the typical quarterly earnings revisions thanks to the TCJA (Tax Cuts & Jobs Act), it was usually noted on this site that readers would see a “decay” in the forward 4-quarter estimate and in forward estimates until the actual quarter started, and then with the release of each quarter’s earnings reports, the “bottom-up” or quarterly EPS estimate for the S&P 500 would increase roughly 3%-5% through the end of the quarter.
Here are a few examples:
Q4 ’18: The Q4 ’18 bottom-up estimate for the S&P 500 started at $40.86 and ended the quarter (3/29/2019) at $41.16 for an increase of 1% through the reporting period. That same estimate for Q4 ’18 as of the end of Sept ’18 was $42.56, so the estimate fell 4% until the actual earnings reports started, and then rose 1% as results came in.
Q3 ’18: The bottom up estimate started at $40.56 and ended at $42.66 for an increase of 5.3% through the reporting period. The estimate for Q3 ’18 as of June 30 ’18 was $41.06.
Q2 ’18: The bottom-up estimate started at $39.20 and ended the end of Sept. ’18 at $41, for an increase of 4.6% through the reporting period.
Q1 ’18: The bottom-up estimate started at $36.16 and ended the quarter at $38.07 for an increase of 5.3% through the reporting period.
Here is another simpler way to lay it out for readers: what is the increase in each of 2018’s quarters bottom-up estimate from start to finish of the reporting period?
- Q4 ’18: +1%
- Q3 ’18: +5.3%
- Q2 ’18: +4.6%
- Q1 ’18: +5.3%
(Source: IBES by Refinitiv data using change in quarterly bottom-up estimate)
Here is IBES by Refinitiv’s published “surprise factor”:
- Q4 ’18 +1% (not yet final)
- Q3 ’18: +6.4%
- Q2 ’18: +5.3%
- Q1 ’18: +6.6%
- Q4 ’17: +4.4%
- Q3 ’17: +4.8%
- Q2 ’17: +5.5%
- Q1 ’17: +6.6%
Latest Weekly S&P 500 earnings data: (Source: This Week in Earnings, IBES by Refinitiv)
- Fwd 4-qtr est: $167.20 down from last week’s $167.41
- PE ratio: 17x
- PEG ratio: 6.44x
- S&P 500 earnings yield: 5.90% vs last week’s 5.98%
- Year-over-year growth of fwd est: +2.6% vs last week’s +2.8%
Summary / conclusion: This week’s S&P 500 earnings update was far more technical than desired, but I wanted readers to see that S&P 500 earnings estimates follow a typical pattern as we move closer to and then through the actual reporting period.
Readers will note that Q4 ’18 S&P 500 earnings results actually showed a far smaller increase of 1% than was typical the last 7 quarters. (The typical upside surprise for the S&P 500 over time 4, 12, and 20, quarters is usually 3%-6% with notable deviations for quarters like Q4, 2008 and then Q3, 1998, which was the LongTerm Capital crisis.)

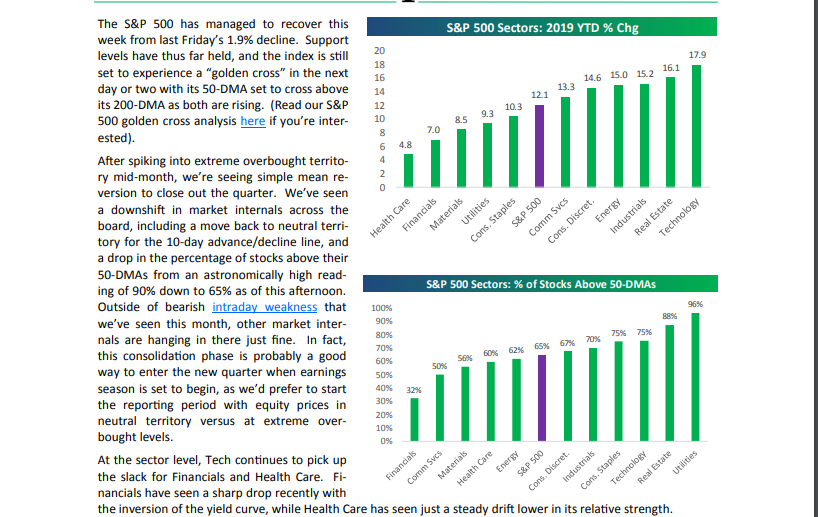
In my opinion, Q1 ’19 S&P 500 earnings revisions and the change in forward estimates will depend on Technology earnings (still the largest sector in the S&P 500 at 20% market cap, and the best performing sector YTD in 2019 thus far) and Financials, which as you can see, according to this Bespoke table from Thursday night’s “Sector Snapshot” is the 2nd worst performing sector in the first quarter of 2019, despite having earnings growth expectations that are still healthy.
Tech and Financials comprise 1/3rd of the S&P 500’s market cap in just those two sectors.
Last week, we noted that we were watching the credit markets closely this past week as the quarter drew to a close, and corporate high-yield in particular acted well. The iShares iBoxx $ High Yield Corporate Bond (NYSE:HYG) has moved further above its 200-week moving average.
I expect that S&P 500 earnings y/y growth rates will gradually improve through 2019 despite tough compares vs 2018, although a weaker dollar would help. The dollar remains persistently strong and with 35%-40% of S&P 500 revenue being “non-U.S”, what the dollar does matters.
Take this all as one opinion and with a healthy degree of skepticism.
