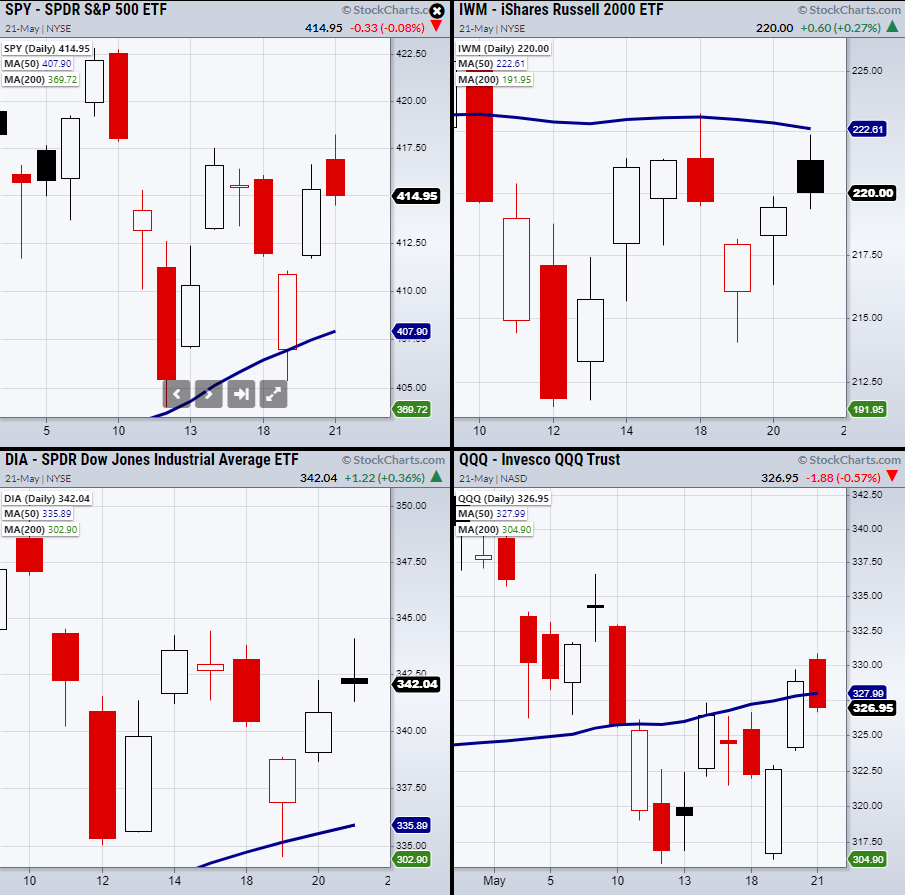
The four major indices were split last week between two phases.

The first was a bullish phase. This is created when the price of a symbol is trading over its 50-Day moving average with the 50-DMA over the 200-DMA.
Both the Dow Jones SPDR® Dow Jones Industrial Average ETF Trust (NYSE:DIA) and the S&P 500 SPDR® S&P 500 (NYSE:SPY) were in bullish phases.
On the other hand, the NASDAQ 100 Invesco QQQ Trust (NASDAQ:QQQ) and the Russell 2000 iShares Russell 2000 ETF (NYSE:IWM) were in cautionary phases.
The only difference between a cautionary phase and a bullish phase is that the price is trading underneath the 50-DMA instead of trading over it.
Last week’s test for the SPY and DIA was passed when both held support created from the 50-DMA. The next test was for the QQQs and IWM to break over resistance from their 50-DMA. While the QQQs was able to break over $328 on Thursday, it was not able to stay over that price level on Friday.
This means that we never got a confirmed phase change in the NASDAQ 100.
Additionally, IWM was even more disappointing as it never broke resistance at $222.70 and instead pulled off from this price level for the second time in one week.
However, the saving grace is that both indices were holding near their resistance levels.
This turns the tables to Monday to decide whether the IWM and QQQ can push through resistance or turn back towards recent lows.
Another noteworthy mention is the SPDR® Bloomberg Barclays High Yield Bond ETF (NYSE:JNK) which was able to hold over its 50-DMA at 108.61.
Because JNK shows investors' risk appetite, it will look great if it can stay over support from the 50-DMA.
Conversely, if JNK breaks down, trade cautiously as the major indices need a fair amount of steam to push back to new highs.
ETF Summary
- S&P 500 (SPY) Choppy price action. Resistance 418 area.
- Russell 2000 (IWM) Support 215. Resistance 222.68.
- Dow (DIA) Flirting with the 10-DMA at 341.91.
- NASDAQ (QQQ) 328.04 the 50-DMA needs to clear.
- KRE (Regional Banks) 71.82 resistance. 68.21 support.
- SMH (Semiconductors) 341.82 resistance.
- IYT (Transportation) Failed to clear the 10-DMA at 273.54.
- IBB (Biotechnology) 151.67 pivotal.
- XRT (Retail) Needs to get back over the 50-DMA at 91.51.
- Volatility Index (VXX) Doji day.
- Junk Bonds (JNK) Support 108.61.
- XLU (Utilities) 65 support.
- SLV (Silver) 24.92 next support.
- VBK (Small Cap Growth ETF) 258.32 support.
- UGA (US Gas Fund) 34.68 resistance area.
- TLT (iShares 20+ Year Treasuries) 137.63 pivotal.
- USD (Dollar) 90.22 resistance.
- MJ (Alternative Harvest ETF) 18.87 support. Cleared the 10-DMA at 20.00.
- LIT (Lithium) Like this to stay over 62.27.
- XOP (Oil and Gas Exploration) Needs to hold 85.69.
- DBA (Agriculture) 18.17 support. Head and shoulders chart pattern.
