The greatest pain trade in today’s highly speculative environment is if financial markets “melt-up before they melt-down” (to borrow Julien Bittel‘s phrase). Bears feel intense FOMO as markets rally despite numerous overbought readings, and bulls face losses if they overextend their stay when the market eventually falls. This is a thought shared by Jeremy Grantham who published an excellent piece worth reading.
Summary
Here’s how I approach markets based on 3 different strategies & time frames. I diversify my portfolio into 3 strategies:
- Long term investors should be highly defensive right now. This speculative bull market may last another 6 months or even 9 months, but in 2 years time, long term investors will be glad they did not buy today.
- Medium term traders should go neither long nor short. Wait. Risk:reward doesn’t favor long positions right now, while shorting into a speculative rally can end in disaster.
- Short term trend followers should continue to ride the bull trend because no one knows exactly when it will end. In a highly speculative environment like today, the most profitable traders are short term trend followers who trade markets with strong animal spirits. If you are a short term trend follower, you must use stops.
Several important factors suggest that we’ll see a significant correction in 2021. Jeremy Grantham’s estimate is that this will occur in late-spring or early summer. In the meantime, short term bulls should continue to ride the uptrend.
The bearish case for contrarian traders
“Buy stocks because they’re cheap relative to bonds”
One of the most popular and sound arguments to buy stocks last March was “stocks are cheap relative to bonds”. If we compare the earnings yield on stocks (inverse of Price/Earnings ratio) vs. the yield on bonds (interest rates), we can see just how cheap stocks were: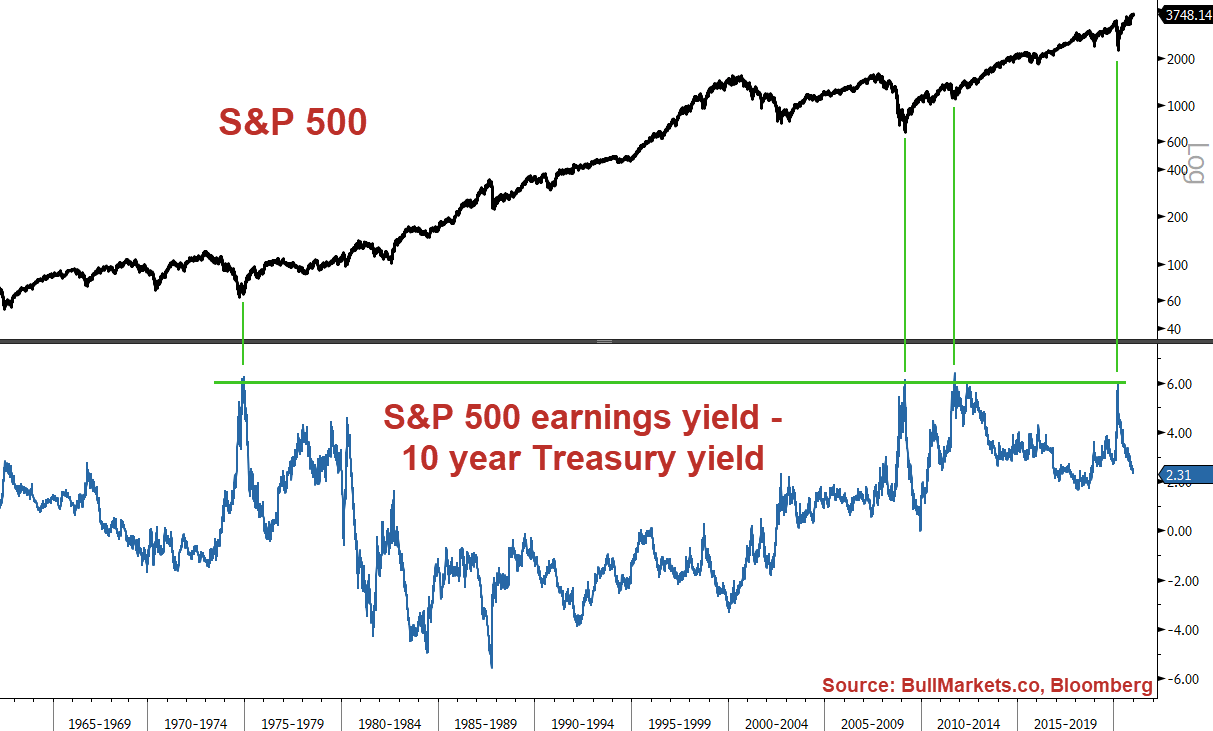
Bloomberg’s Lisa Abramowicz noted an important development: rising stock prices (falling S&P 500 earnings yield) and rising interest rates are weakening this bullish argument. The following is a 200 day change in the S&P 500 earnings yield vs. the 10-year Treasury yield: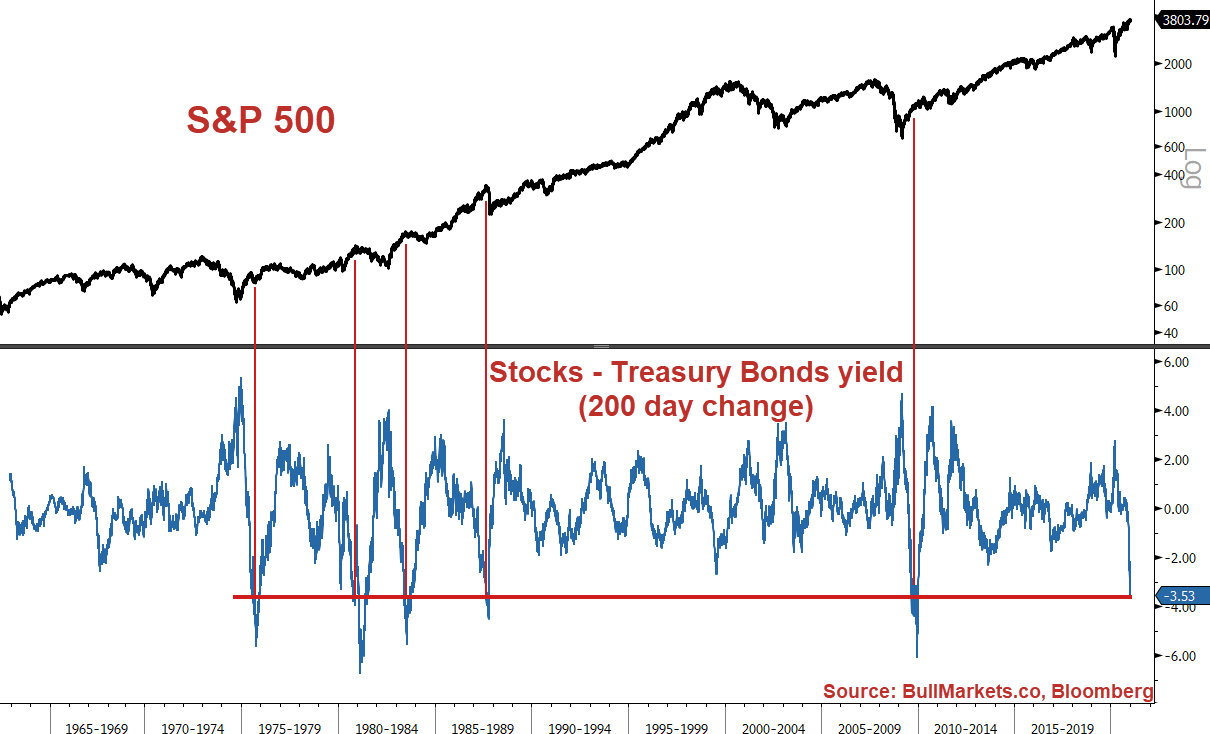
Such an increase in stock market valuations relative to bonds often led to major stock market volatility 9-12 months later. Stocks could first rally higher, but the day of reckoning was not pretty. This is something we need to be careful of from Q2 2021 onwards.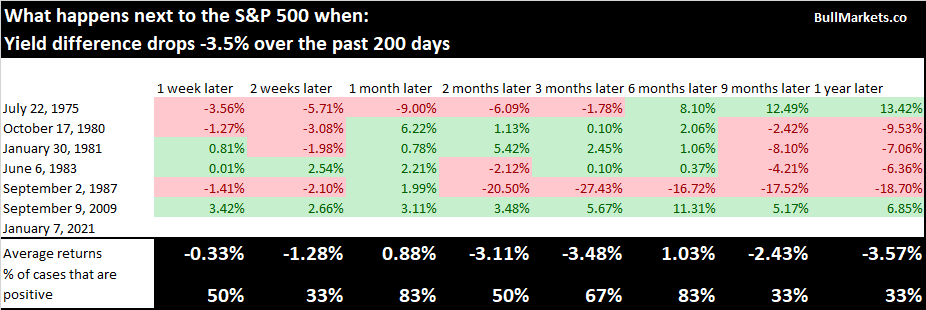
Analysts are ramping up price targets
Analysts downgraded their price targets for equities at the fastest pace ever last March. Now they’re rapidly upgrading price targets.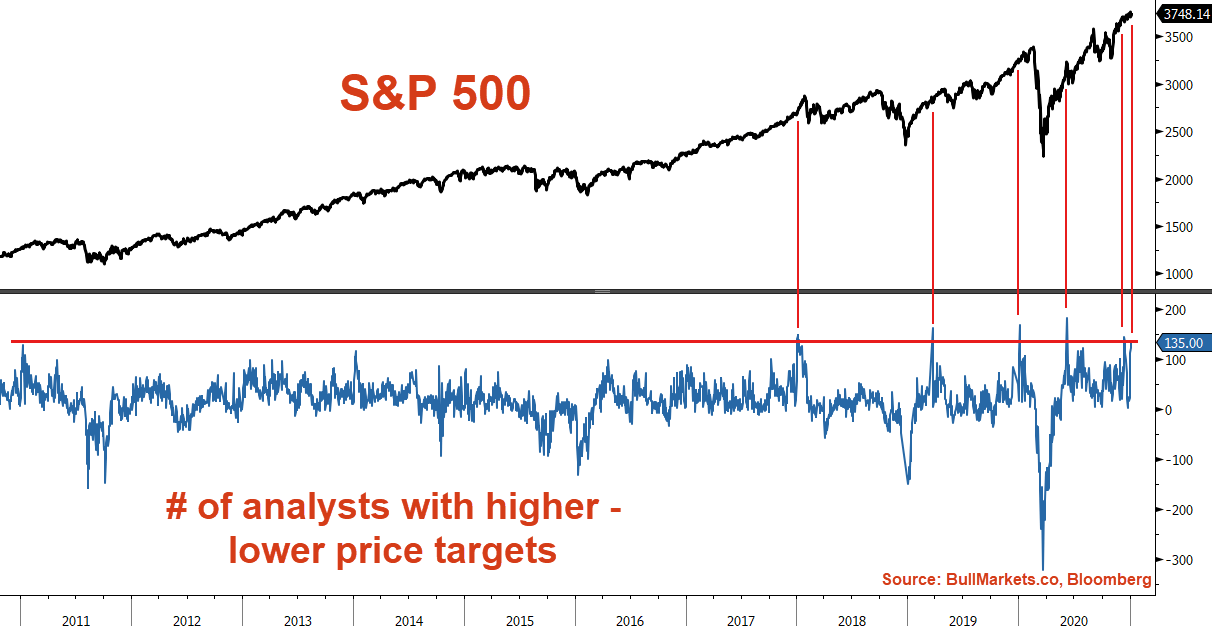
This is a small warning sign for stocks over the next few months: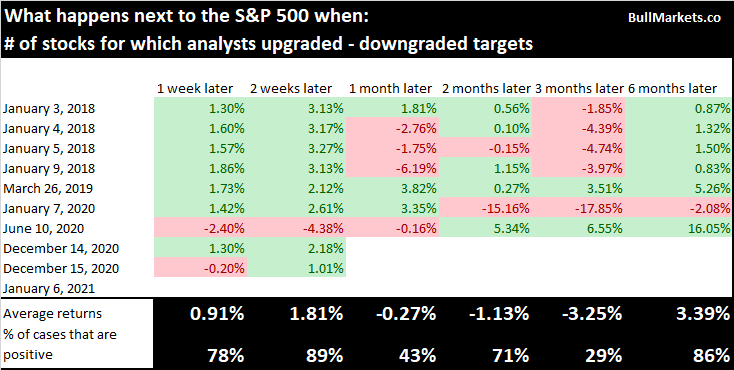
Rising risk
As I noted on Thursday, SKEW‘s 3 week average continues to rise. SKEW measures the risk of a black swan event, so traders usually interpret high SKEW readings = bearish.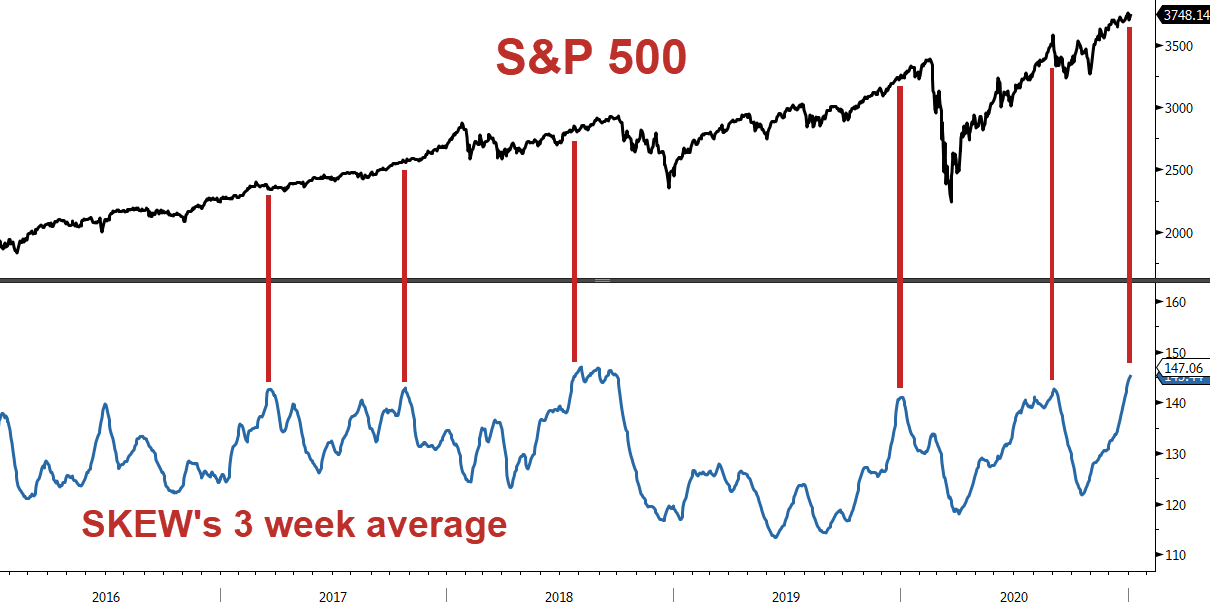
In the past, such high readings were something to be concerned about, but didn’t always result in an immediate correction.
- October 2017: stocks rallied for another 3 months before VIX spiked and stocks fell.
- July 2018: stocks rallied for another 2 months before stocks fell in Q4 2018.
- January 2020: stocks rallied for another 1.5 months before the crash in March.
- September 2020: stocks fell immediately.
Watch out for SKEW in the coming months.
Sentiment surveys
Bulls staged a comeback in the AAII sentiment survey. A 9 week average of the % of bulls reached the highest level since early-2018:
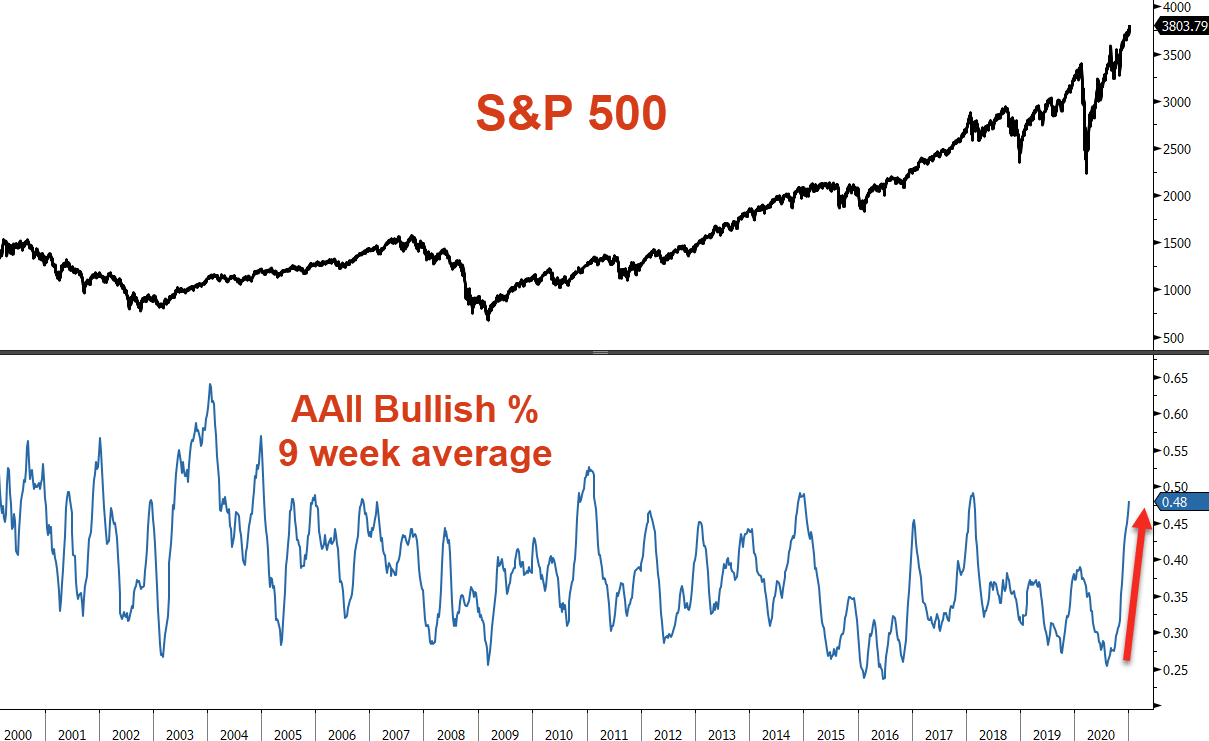
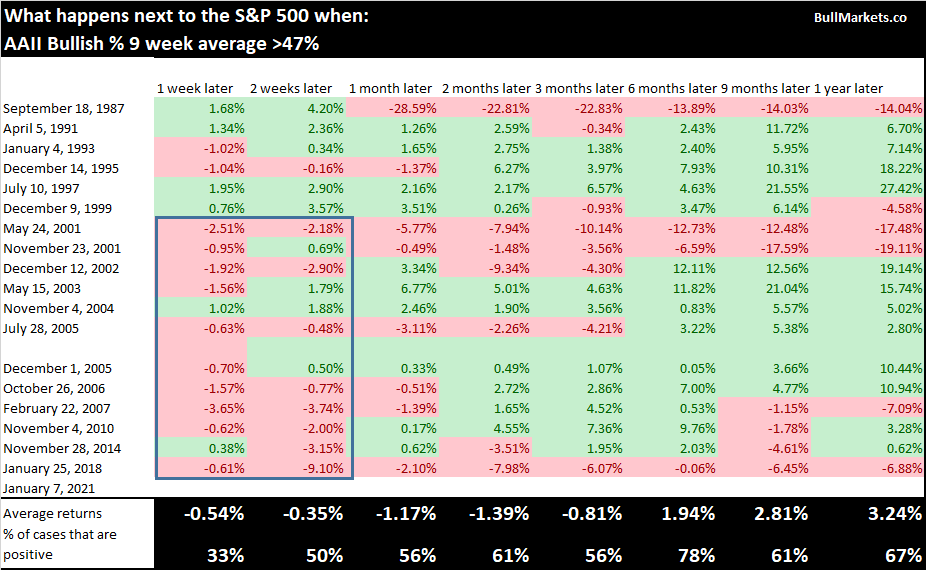
Given the highly speculative environment we’re in today, I put less emphasis on sentiment surveys. This is just a very minor short term bearish worry:
Insiders (still not buying)
And lastly, the S&P 500’s corporate insider buy/sell ratio’s 1 month average is still very low. Insiders, who usually buy when stocks fall, have no reason to chase the rally.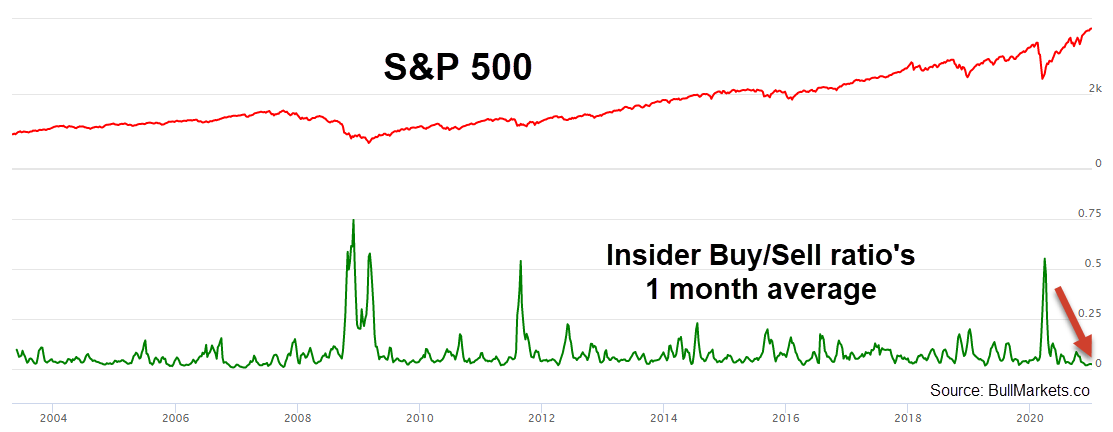
Bullish case for trend followers
Breadth
Strong breadth remains supportive of bullish trend followers. 85% of the NASDAQ Composite are in medium term uptrends (above their 50 dma):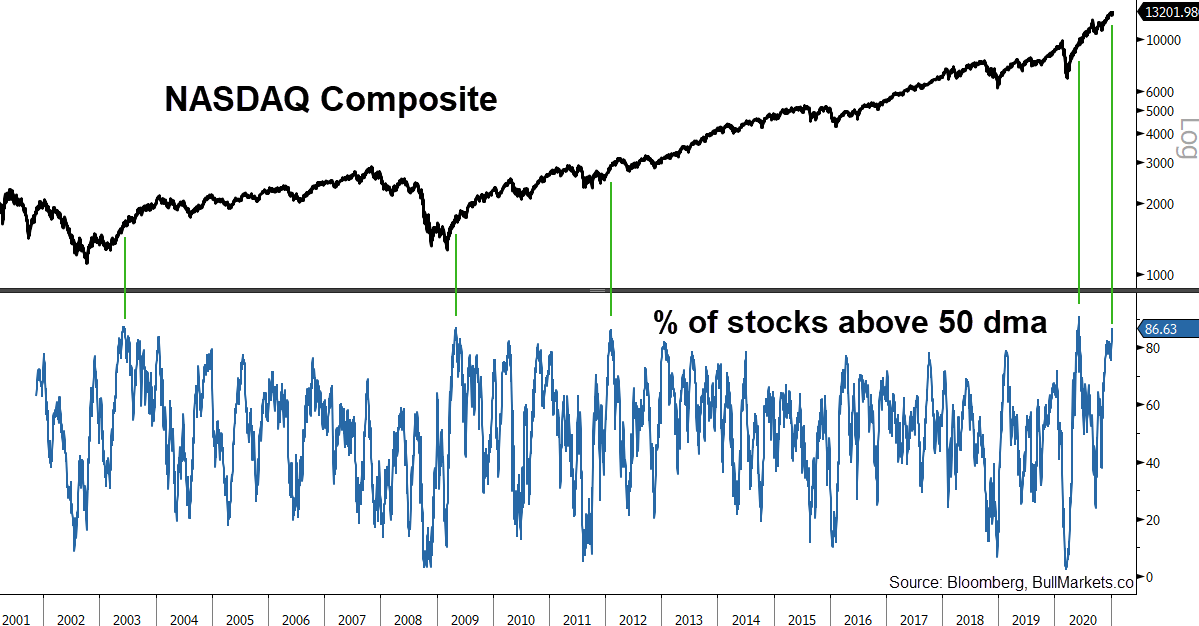
These breadth thrusts were followed by more gains for stocks over the next year:
In the meantime, the MSCI Emerging Markets Index broke out and made its first all-time high since 2007! A large % of stocks in the S&P 500, Russell 2000, NASDAQ Composite, and MSCI Emerging Markets Index are at 52 week highs. The following demonstrates a spike in 52 week highs all around the world.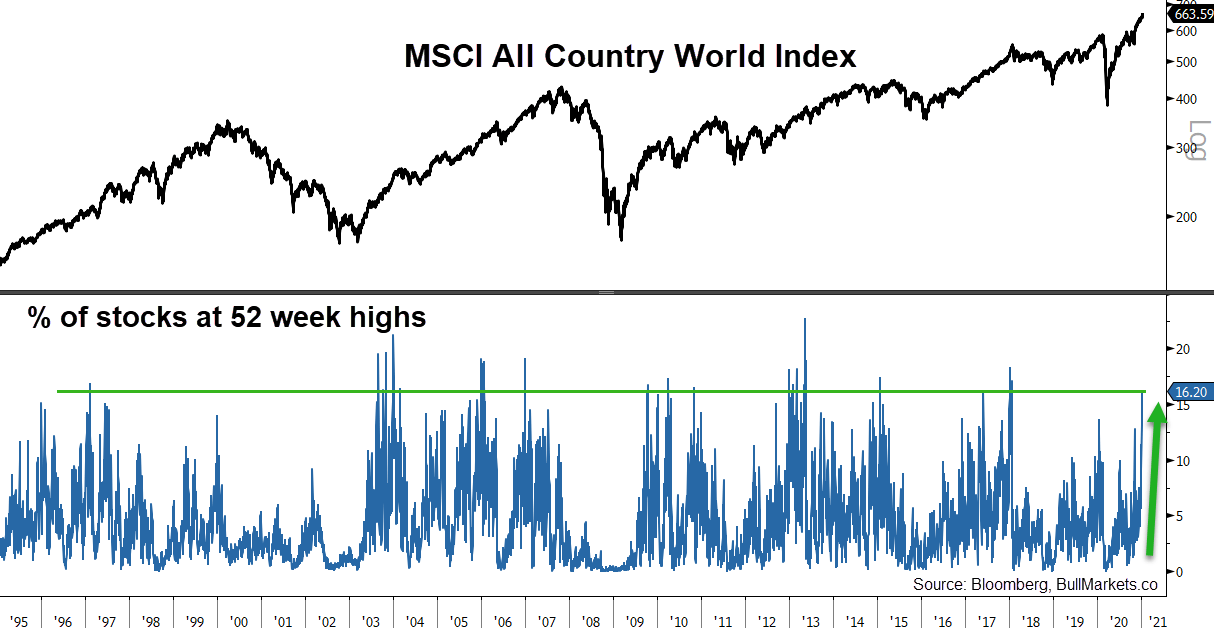
Most historical cases were followed by short term pullbacks and then more gains after that: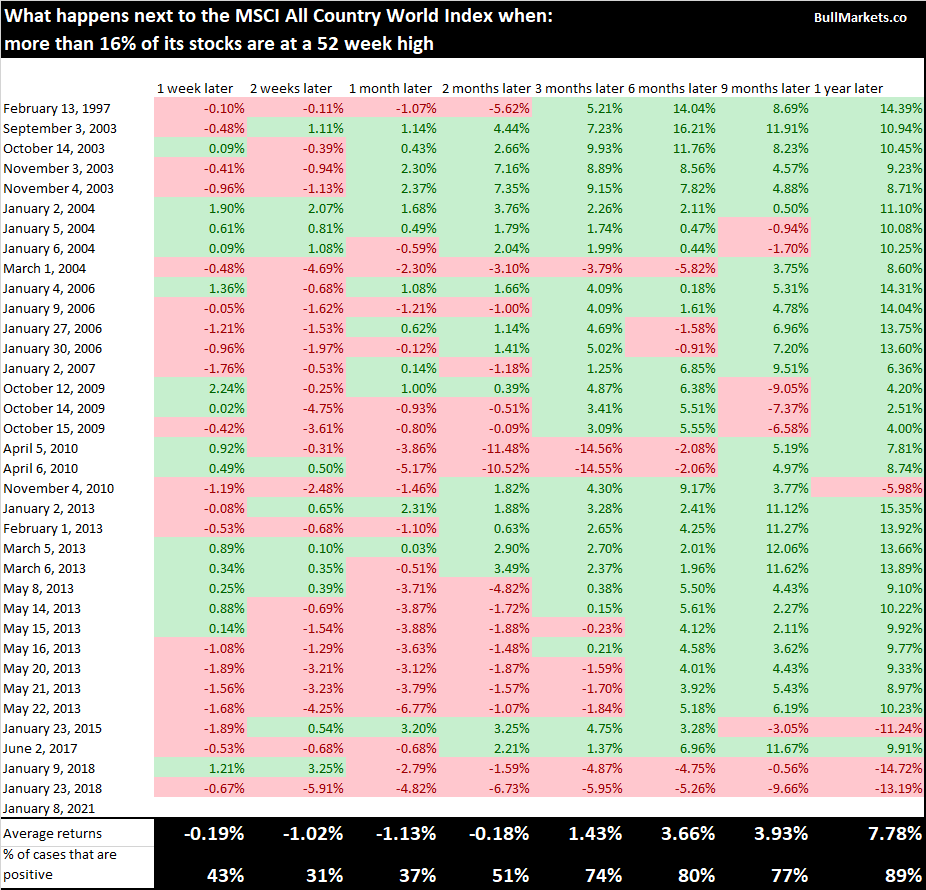
Falling short interest
NYSE Short Interest fell significantly since March as the rally punished bears: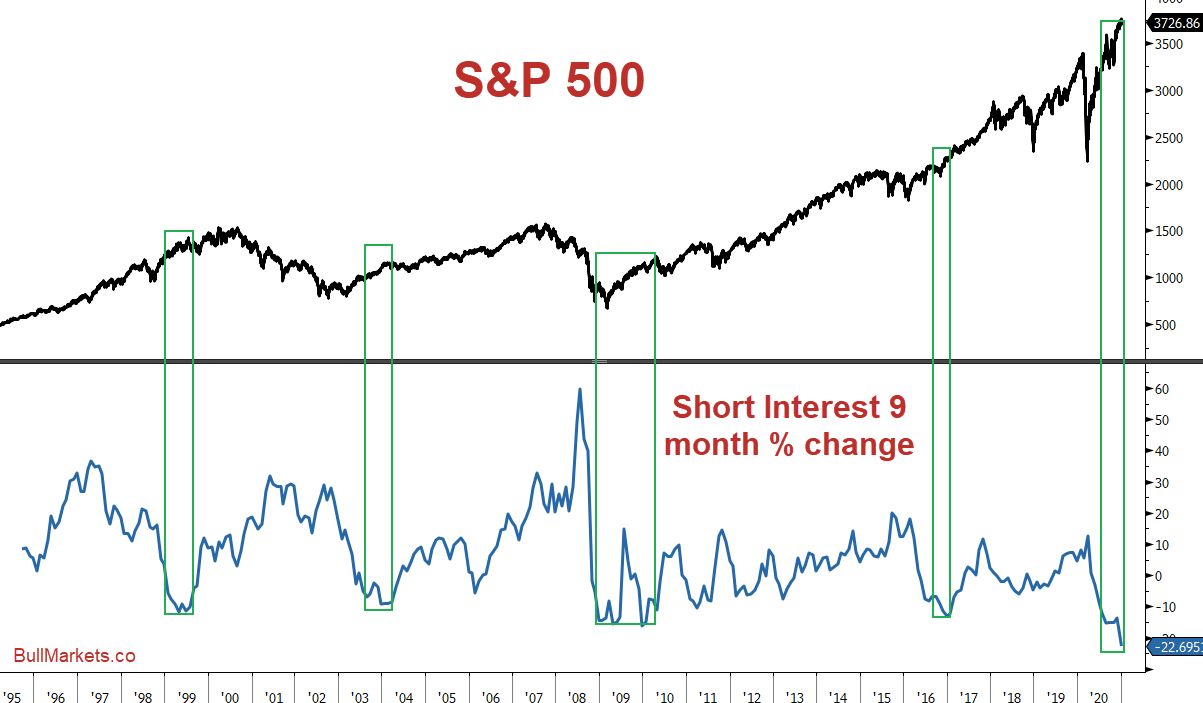
Short interest usually collapse when stocks surged after major periods of market & economic uncertainty:
- After the stock market crash in August 1998
- After the 2000-2002 bear market
- After the 2007-2008 bear market
- After the 2015-2016 global economic slowdown
As a result, the S&P always rallied over the next 9-12 months. Of particular interest is the 1999 dot-com bubble case. Back then, the melt-up continued for another half year before stocks melt-down.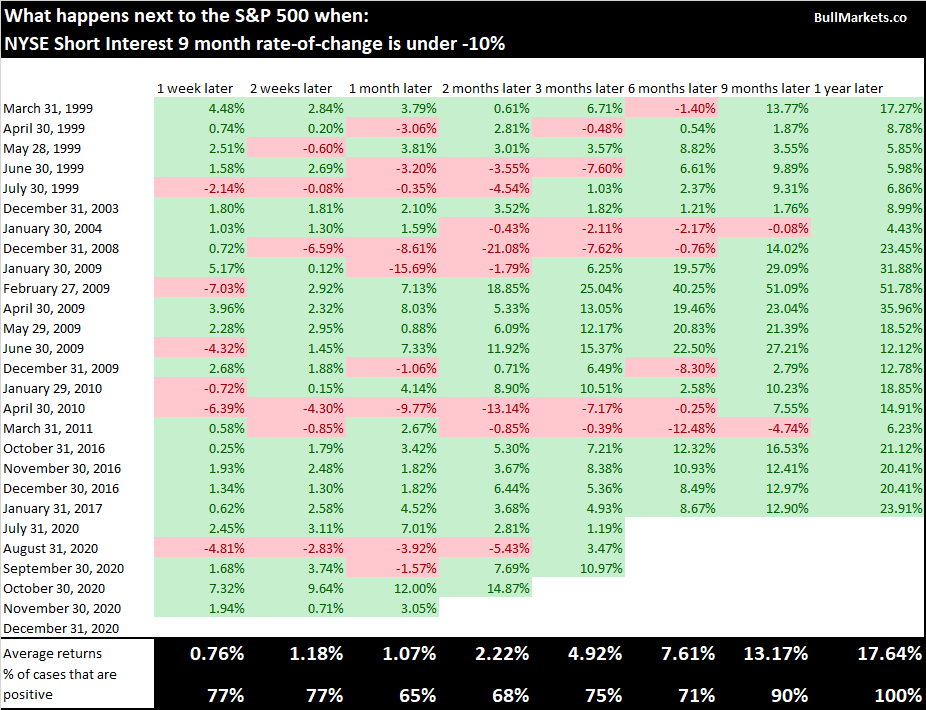
Strong buying in dark pools
SqueezeMetrics publishes a fantastic indicator called the Dark Index (DIX). High DIX readings suggest strong buying in dark pools (go here for a more detailed explanation).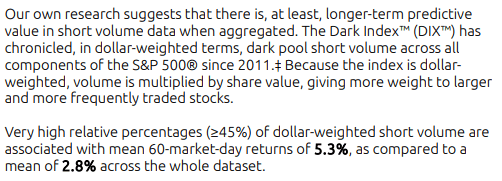
DIX is currently at 48%, a relatively high reading: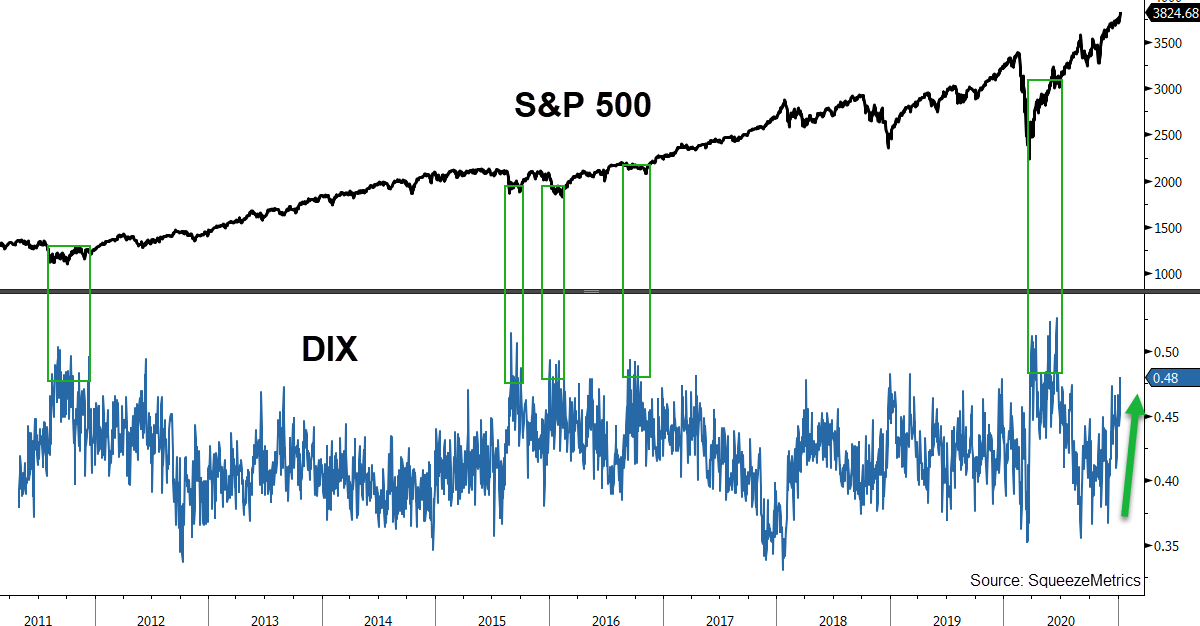
On the 121 other days this happened, stocks performed well in the coming months:
*Historical data for this indicator is limited, so this is just food for thought.
Conclusion
- Long term investors should be highly defensive right now. This speculative bull market may last another 6 months or even 9 months, but in 2 years time, long term investors will be glad they did not buy today.
- Medium term traders should go neither long nor short.
- Short term trend followers should continue to ride the bull trend because no one knows exactly when it will end.
Know your trading strategy(s), know your time frame, stick to it. To a great 2021!
Troy
