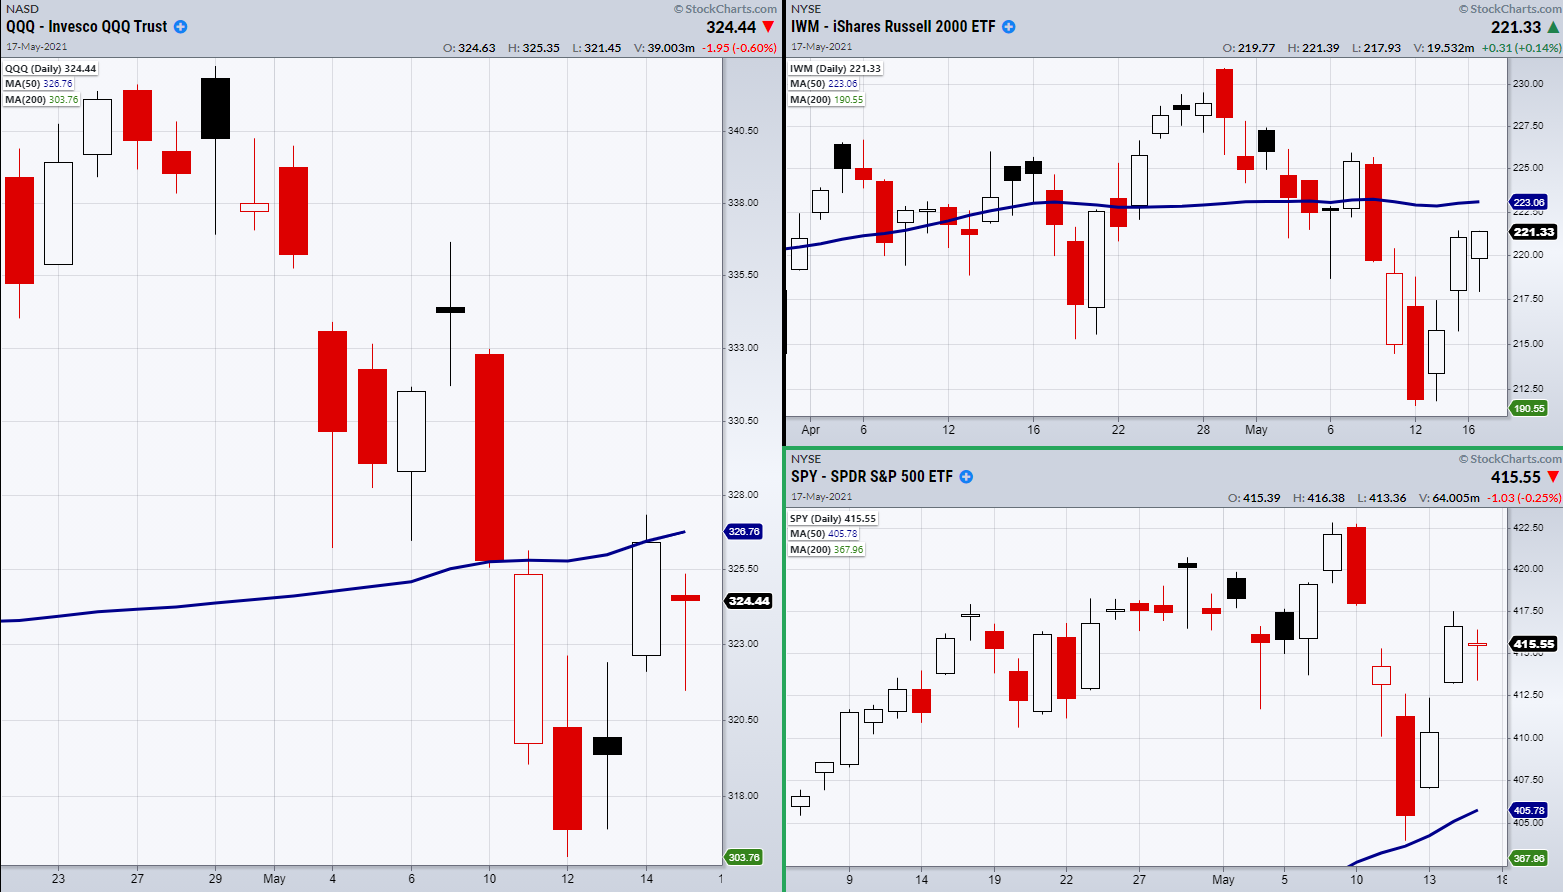
Last Friday the market closed on a high note with a rally off the lows of 05/12.
This was a bullish sign, yet the rally also pushed prices into a resistance area.

The mixed sentiment from traders could be seen in Monday’s major indices with an inside day pattern found in the Russell 2000 (IWM) and the S&P 500 (SPY).
An inside day pattern is created when the total range of a price candle fits within the prior days' range.
This creates an easy way to watch for either a breakout or breakdown based on resistance/support from the prior days high/low.
However, a clean break over Friday’s high brings the market back into a choppy area, while a drop past Friday's lows would have investors looking towards the next key support area to hold from 05/12.
Additionally, the NASDAQ 100 (QQQ) had resistance not only from Friday’s highs but also from the 50-Day moving average found at $326.84.
As seen in the charts above, this gives us key levels to watch for a break over with a clean support area to hold if bullish sentiment prevails.
ETF Summary
- S&P 500 (SPY) Held the 10-DMA at 415.25.
- Russell 2000 (IWM) Support 215. Resistance 223.17.
- Dow (DIA) Like this to hold over 342.43.
- NASDAQ (QQQ) 326 resistance.
- KRE (Regional Banks) 71.82 resistance.
- SMH (Semiconductors) 233 pivotal area.
- IYT (Transportation) 282.40 resistance.
- IBB (Biotechnology) 147.11 support.
- XRT (Retail) 96.27 resistance.
- Volatility Index (VXX) Failed to break over Friday’s highs at 41.50.
- Junk Bonds (JNK) 108.55 support the 50-DMA.
- XLU (Utilities) Next support the 50-DMA at 64.68.
- SLV (Silver) Needs to clear 26.28.
- VBK (Small Cap Growth ETF) 258.32 support with main support the 200-DMA at 254.10.
- UGA (US Gas Fund) 34.68 resistance area.
- TLT (iShares 20+ Year Treasuries) 135.00 support area.
- USD (Dollar) Watching to hold 90.00.
- MJ (Alternative Harvest ETF) Watching to hold over 19.83.
- LIT (Lithium) 60.31 the 50-DMA.
- XOP (Oil and Gas Exploration) 92.24 resistance.
- DBA (Agriculture) 18.17 next support
