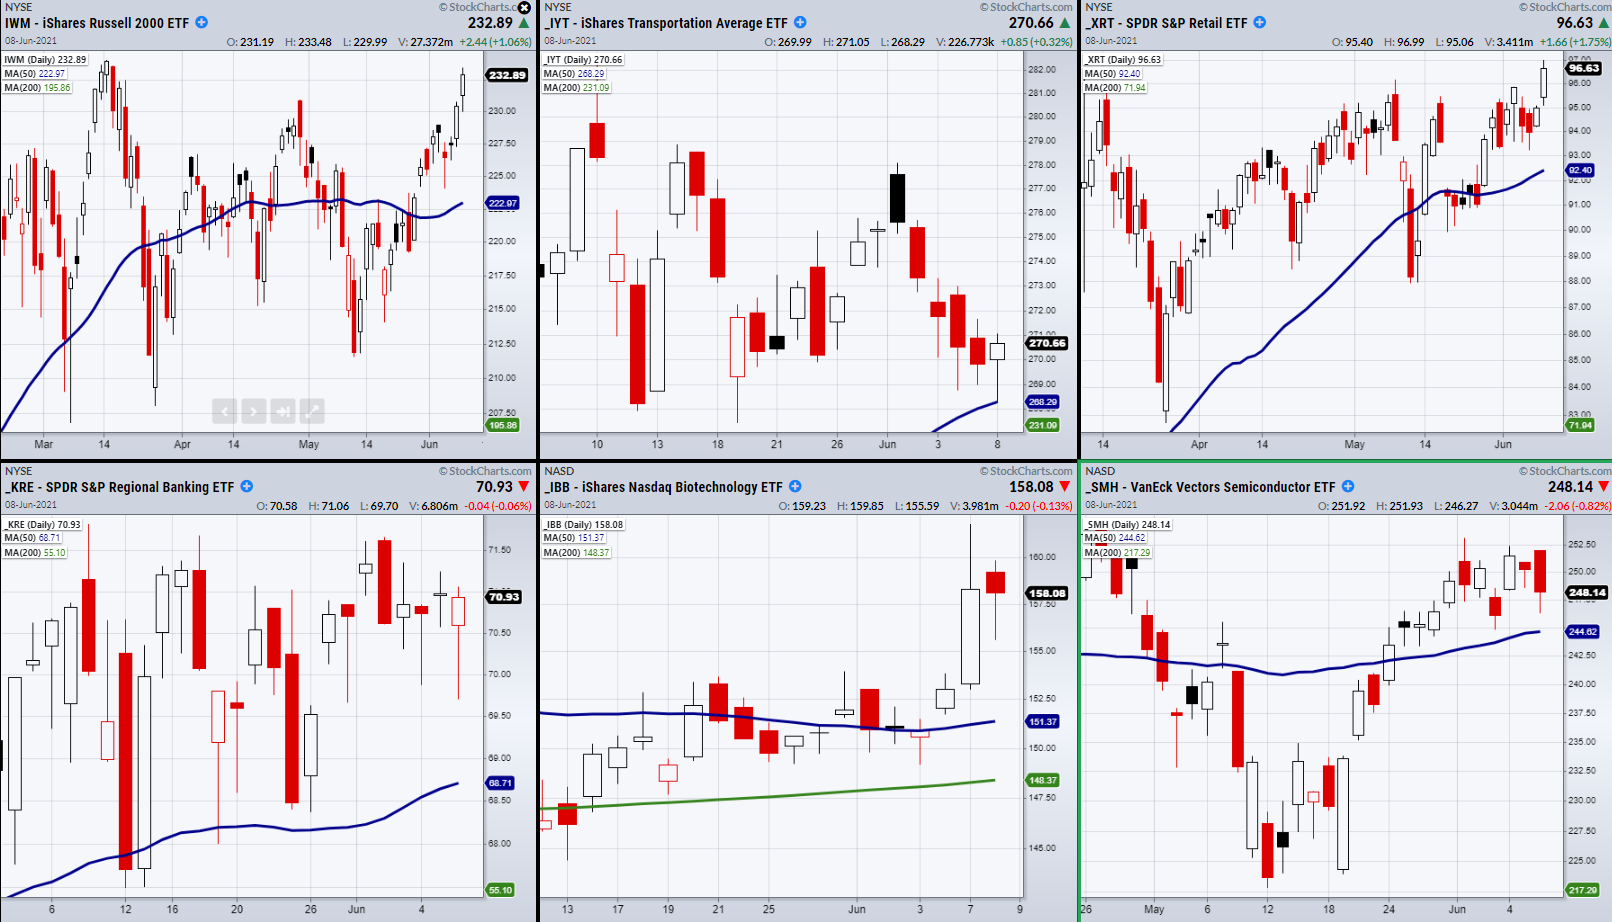
The transportation sector—iShares Transportation Average ETF (NYSE:IYT)—bounced off $268, closing +.32% on the day.
This was a pivotal level to hold and becomes more important when compared to the rest of Mish’s Economic Modern Family.

Besides IYT, the Family consists of:
- Retail—SPDR® S&P Retail ETF (NYSE:XRT)
- Regional Banking—SPDR® S&P Regional Banking ETF (NYSE:KRE)
- Biotech—iShares NASDAQ Biotechnology ETF (NASDAQ:IBB)
- Semiconductors—VanEck Vectors Semiconductor ETF (NASDAQ:SMH), and
- The small-cap index Russell 2000—iShares Russell 2000 ETF (NYSE:IWM)
The Family provides an easy way to grasp a quick picture of the overall market direction. As seen in the charts above, IYT was the only member to test its 50-Day moving average.
Moreover, while other members are not far from their 50-DMA, we have paid special attention to the transportation sectors as it shows investors sentiment towards the movement of goods.
The general idea is that if the movement of goods begins to slow, it could be a warning signal for the rest of the market, which relies upon its long-term strength to push to new highs.
While IYT held this specific price level, IWM and XRT cleared their important levels. IWM was able to clear resistance from its previous high on Apr. 29 at $230.95 and retail XRT broke its high from Mar. 10 at $96.27.
With that said, the market has not been easy to trade, and while IYT was able to hold over $268 Tuesday, the volatility near these pivotal price areas has increased. Therefore, we can continue to watch for these breakout and support prices to hold going through the week.
It should also be noted that Thursday, the CPI (Consumer Price Index) report is released, which is a way for the Fed to gauge the rate of inflation and progress of the economy.
While the Fed has kept a firm stance that it does not want to make any changes until it has seen a larger economic recovery, the report still can hint towards policy adjustments later down the road.
ETF Summary
- S&P 500 (SPY) 422.82 needs to clear and hold. Bounced off the 10-DMA 4.20.26.
- Russell 2000 (IWM) 234.53 high to clear.
- Dow (DIA) 351 resistance. 342.43 support.
- NASDAQ (QQQ) 338.19 resistance area.
- KRE (Regional Banks) Holding 70.00 with 71.82 resistance.
- SMH (Semiconductors) 244.61 support. 258.59 resistance.
- IYT (Transportation) 268.30 the 50-DMA.
- IBB (Biotechnology) 159.30 resistance area.
- XRT (Retail) Cleared 96.27 resistance.
- Volatility Index (VXX) Needs to clear 33.66.
- Junk Bonds (JNK) Needs to hold over 109.12.
- XLU (Utilities) Very choppy. 64.49 support.
- SLV (Silver) 26.43 resistance.
- VBK (Small Cap Growth ETF) Confirmed bullish phase with second close over the 50-DMA.
- UGA (US Gas Fund) Needs to hold over 34.75 area.
- TLT (iShares 20+ Year Treasuries) 140.60 next level to clear and hold.
- USD (Dollar) 89.54 support.
- MJ (Alternative Harvest ETF) Needs to clear and hold over 22.02.
- LIT (Lithium) 69.75 next level to clear.
- XOP (Oil and Gas Exploration) 92.24 support.
- DBA (Agriculture) 18.73 support. 19.36 high to clear.
- GLD (Gold Trust) 177.97 gap to fill.
