Some bear markets feature dreadful price catastrophes that occur quickly. At the onset of last decade’s banking crisis, the S&P 500 plummeted close to the requisite 20% bear level in a five month period between October of 2007 and March of 2008. The Federal Reserve joined JP Morgan Chase (N:JPM) in bailing out Bear Stearns to provide a brief relief rally. However, the second leg down between May of 2008 and March of 2009 led to the 56% top-to-bottom depreciation of capital that destroyed portfolios in a relatively brief span of 17 months.
Other bear markets are lengthy, drawn-out downtrends. The S&P 500 hit a record peak of 1527 in March of 2000. In spite of a springtime correction, the S&P 500 was back above 1500 by September – six months later; in fact, the benchmark only fell short of logging another record high by less than one-half of one percent (9/1/2000). The failure to eclipse the earlier highs – a setback that had been accompanied by a breakdown in market breadth, credit spread deterioration, the disaster brewing in the influential tech sector as well as severe stock overvaluation – doomed the popular index for the next two years. The 49% top-to-bottom capital evisceration occurred over a lengthy 30 month period that did not approach bearish levels until nearly one full year in.
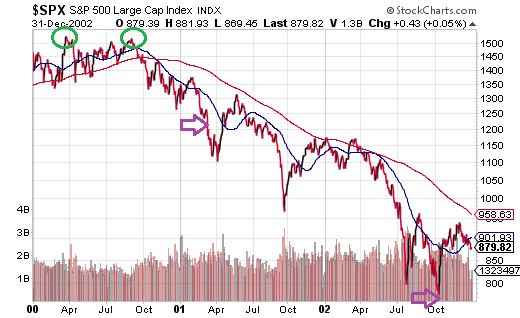
I am less inclined to compare today’s circumstances to those of the year 2000 than I am to the year 1937. And even then, historical comparisons provide insight; they do not help an investor predict the future. (Review “Do Historical Comparisons Matter? Strong Similarities Between 1937 And 2015.”) That said, the purpose in highlighting the course of the 2000-2002 bear is to explain that bearish implications for a large-company, market-cap weighted benchmark like the S&P 500 may take significant time to materialize; indeed, a wide variety of asset types as well as an increasing number of individual stocks in the index had broken down well in advance of the one-year mark.
Flash forward 15 years. We hit an all-time record in May of 2015. We experienced a 12% summertime correction that escalated in August and September. Yet, in much the same way that the S&P 500 rose back above 1500 to come within spitting distance of an all-time pinnacle in the year 2000, the S&P 500 climbed above 2100 to get within 1 percentage point of a brand new record in November of 2015. Again, this occurred six months later. Lost in the shuffle? With the S&P 500 currently 5.5% below that all-time record (1/5/2016 intra-day trading), few are discussing the real possibility that last May might have been the market top for this cycle. (Review my commentary prior to the volatile August-September sell-off “A Market Top? 15 Warning Signs.”)
Could this be an arduous, time-consuming, faith-depleting bear for the big-caps? It certainly could be. In my estimation, however, a great deal will depend upon the direction of the U.S. economy, the direction of Fed policy, the direction of corporate revenue and profits as well as the direction of market internals.
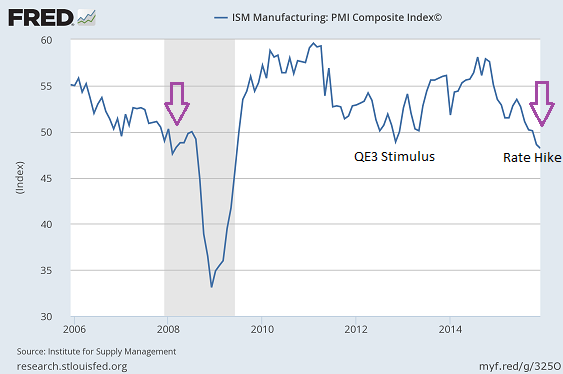
Let me begin with the U.S. economy. Although gross domestic product (GDP) may be averaging 2% annualized growth in the seven year recovery, the evidence of deceleration has been piling up. U.S. company exports have been decimated by weak demand from overseas as well as the strong dollar. Employee productivity is a fraction of its average over the prior 15 years and continues to wane. Equally disconcerting? Manufacturing via the Institute for Supply Management’s PMI (48.2) has not been this dismal since the Great Recession.
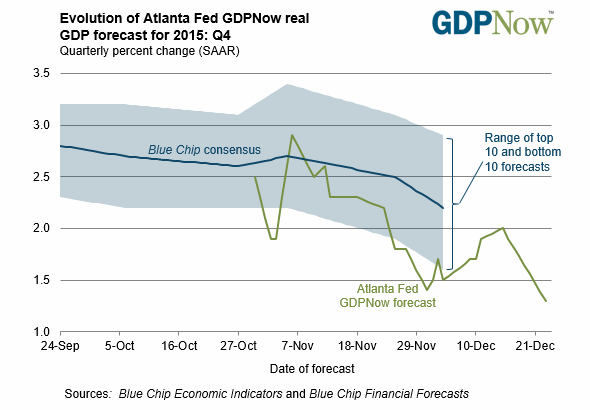
Think that manufacturing doesn’t matter? Believe that export demand and international trade are irrelevant? Not convinced that employee productivity data impacts the direction of a country’s output? Well, the Atlanta Fed does. In fact, as of right now, the Atlanta Fed estimates 0.7% Q4 growth, which is hardly the best time to begin raising borrowing costs. Even if one dismisses the Atlanta Fed outright, the trajectory of economic estimates from the rosiest economists have been decaying, not improving.
Admittedly, Fed policy direction may be a bigger wildcard than at first blush. Most market watchers expect several more hikes to the Fed’s overall lending rate in 2016. On the flip side, fear of a carry-over effect from China’s slowdown caused committee members to balk at increasing the price of money back in September. Isn’t it possible that the Fed’s “data-dependency” – domestic GDP deceleration, weak demand from emergers like China, volatile market swings – could result in an extended pause? Perhaps the Fed can goose asset prices and confidence by not beating a hawkish chest.
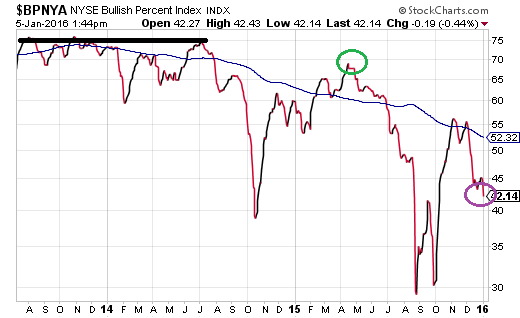
What is less of a wildcard? The weakness in market internals with breadth of stock participation at the forefront. Should one exhibit glass half-full optimism when a meager 42% of securities trading on the New York Stock Exchange (NYSE) offer bullish uptrends? Not when strong bull markets typically offer 75% of issues in uptrends. In truth, the possibility of May’s S&P 500 top is largely confirmed by the last time that nearly 70% of securities on the NYSE participated.
Equally disturbing have been data showing that the median stock in the Russell 3000 is already down 20% from 52-week highs. Granted, there’s no such thing as a “median stock bear.” On the other hand, when equal-weighted indices of 1700 issues like the Value Line Index drop 16% from 52-week highs set very near the May 2015 top for the S&P 500, it is difficult to set aside the reality that deterioration within the broader stock landscape may be forewarning excessive risk takers.
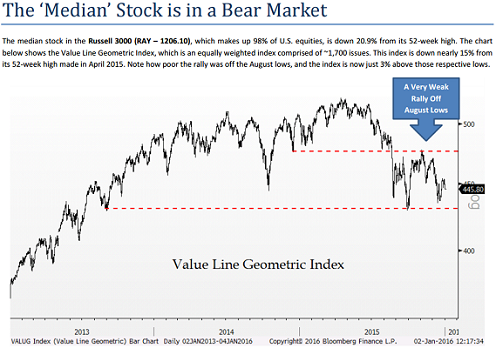
Bearish price movement often results when signs of economic weakness, indications of deteriorating market internals and the potential for Fed policy error collide. The direction of these items – economy, market internals, Fed policy – is what encourages safety-seeking over risk-taking (and vice versa). For instance, a recession is not necessary for the occurrence of a bear market, but fear of economic deceleration is. In fact, over the last six decades, there were non-recession 20%-plus bearish drops in 1962, 1966, 1978 and 1987. Even if you were led to believe that only a recession can bring about a stock bear, then you may want to revisit the last two stock bears (3/2000-10/2002 and 10/2007-3/2009). Recession identification came long after the monstrous price declines had already transpired.
Of course, corporate revenues and corporate profits serve as the collective backbone for all market-based asset types. Stocks might be able to handle the headwinds described above if profitability and revenue generation pick up measurably. Here’s the problem: We are already beginning from a place of significant stock overvaluation, leaving little room for error.
Indeed, part of 2015’s stock woes can be attributed to S&P 500 earnings seen rising 8% at the start of the year, while FactSet’s computations on year-end consensus come in at a 0.7% decline for 2015. No earnings growth, no price growth. Almost as if Wall Street never learns, the forecasts for 2016 are extremely similar. We’re supposed to see 8% earnings growth in 2016, which is likely to be reduced, as it has in most years of the current recovery. If we’re lucky enough to see 5%-7% earnings growth, we would still be a long way from the 2014 pinnacle in earnings of $106 per stock share back on 9/30/2014. In other words, if we’re lucky to get back to $100 per share from roughly $92 per stock share, would investors eagerly pay more than they did on 9/30/2014? When the S&P 500 logged 1972? At $100 per share that we are likely to see 12 months from now, even the S&P 500 at 2100 is a frothy P/E of 21.
Our positions at Pacific Park Financial, Inc. for moderate growth and income clients have not changed much since May of last year. Specifically, we downshifted from a target allocation of 70% growth across a wider array of stock types (e.g., large, small, foreign, etc.) to 50%-55% growth concentrated in large U.S. issues alone. Even there, we have tended to favor holdings with lower betas, including iShares MSCI USA Minimum Volatility (N:USMV), Vanguard High Dividend Yield (N:VYM), iShares Core S&P 500 (N:IVV) and Health Care Select Sector SPDR (N:XLV).
Similarly, we downshifted from a target allocation of 30% income across a wider array of income types (e.g., short, long, muni, treasury, investment grade, preferreds, higher yielding, etc.) to 25% intermediate investment grade and munis. We have been long-term holders if iShares 7-10 Year Treasury Bond (N:IEF), SPDR Nuveen Barclays (L:BARC) Municipal Bond (N:TFI) as well as iShares US Preferred Stock (N:PFF).
Without a definitive stock uptrend for the majority of issues, re-acceleration of the economy, definitive earnings/sales growth and/or a shift in Fed policy, we are unlikely to redeploy the 20% in cash equivalents. In truth, the increasing likelihood of a bear in the big-caps may require an additional shift toward protection such that our tactical asset allocation might offer three buckets: (1) one-third lower beta stock, (2) one third investment grade bond, (3) one-third cash equivalents for buying growth at more reasonable prices.
Disclosure: Gary Gordon, MS, CFP is the president of Pacific Park Financial, Inc., a Registered Investment Adviser with the SEC. Gary Gordon, Pacific Park Financial, Inc, and/or its clients may hold positions in the ETFs, mutual funds, and/or any investment asset mentioned above. The commentary does not constitute individualized investment advice. The opinions offered herein are not personalized recommendations to buy, sell or hold securities. At times, issuers of exchange-traded products compensate Pacific Park Financial, Inc. or its subsidiaries for advertising at the ETF Expert web site. ETF Expert content is created independently of any advertising relationships.
